📱 Case Study · iOS App

Personal Finance Dashboard App

An all-in-one, locally-encrypted personal finance tracker for iPhone
iOS app solo-built from a team web concept · Since 2026/05
Problem Tech Stack Trade-offs Features My Role Challenges Demo

Problem Background

Tech Stack

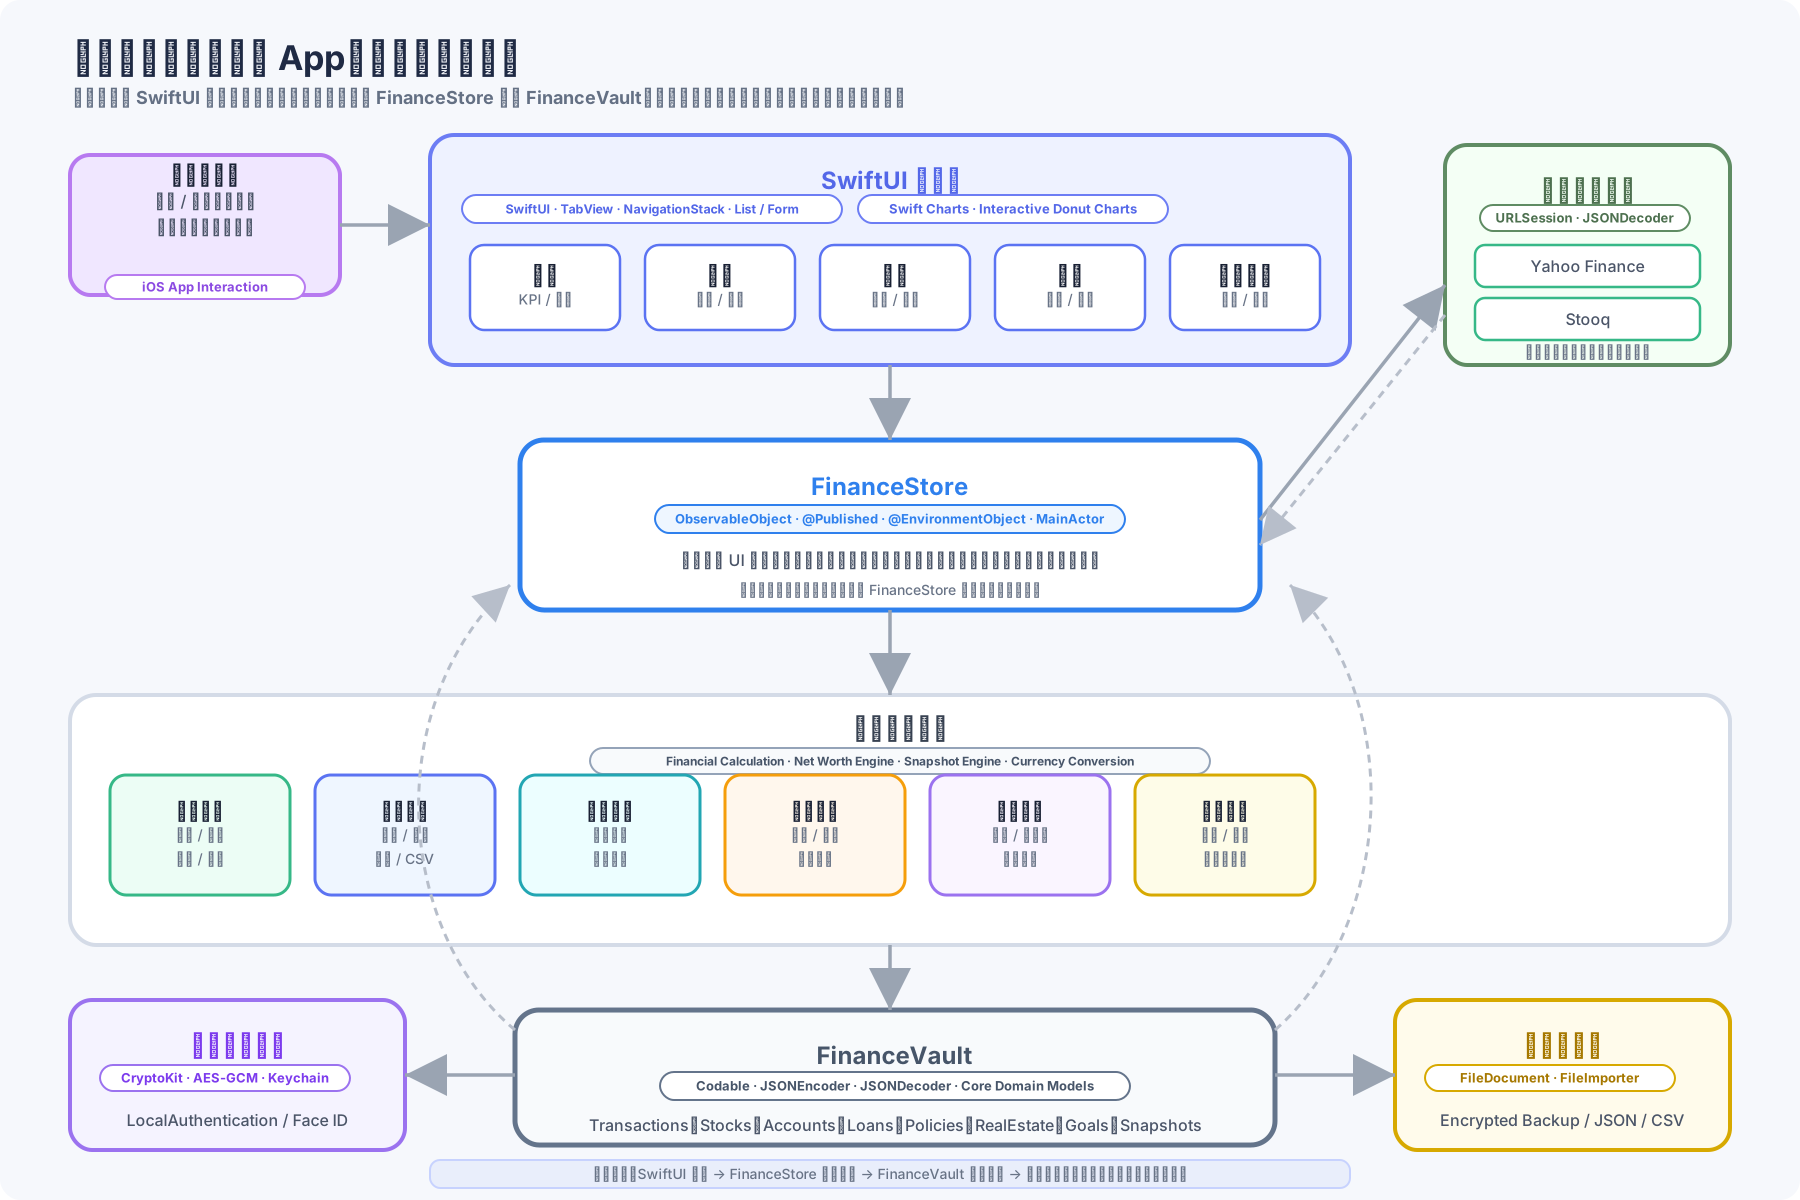
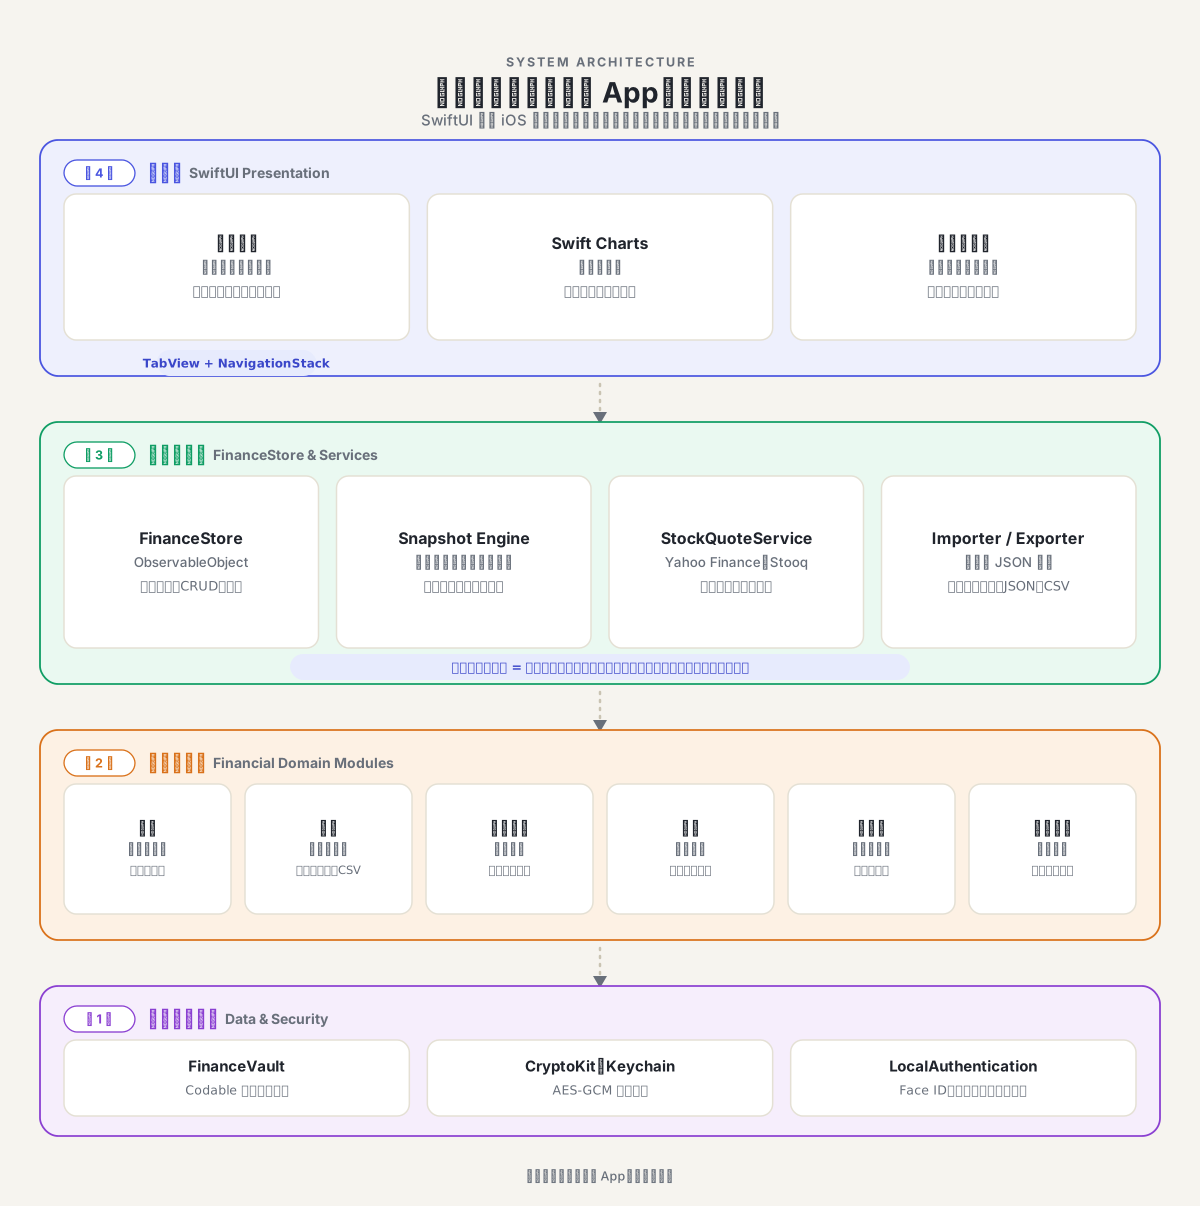
System architecture diagram
5-layer architecture diagram
5-layer architecture: presentation (SwiftUI), interactive components (Charts / Forms / Export), application logic (Store / Snapshot / Quote / Import-Export / Advice), financial domain modules (expenses, investing, banking, insurance, real estate, planning), and data & security (FinanceVault, AES-GCM, Keychain, Face ID)

Interface

SwiftUI Swift Charts

Data & State

FinanceStore (ObservableObject) FinanceVault Data Model Local JSON Storage

Integrations & Services

StockQuoteService Yahoo Finance / Stooq WebDashboardImporter CSV / JSON Export

Security

CryptoKit (AES-GCM) Keychain LocalAuthentication (Face ID)

Engineering Trade-offs

Cost
    Speed
      Accuracy
        Stability

          Features

          Financial Overview

            Daily Expense Tracking

              Stock Investment

                Banking & Loans

                  Insurance Policies

                    Real Estate

                      Financial Planning

                        Data Security & Backup

                          My Role

                          Janice
                          Product Designer / Concept Owner

                          Janice came up with the project's core concept, planned the overall feature architecture of the finance dashboard, and designed and built the web version — laying the foundation for the iOS app that followed.

                          Me
                          iOS App Developer / System Builder

                            Challenges & Solutions

                            1 Financial data scattered across platforms

                            Problem

                            Solution

                              2 Users need long-term tracking, not just a snapshot

                              Problem

                              Solution

                                3 Web JSON format didn't match the app's data model

                                Problem

                                Solution

                                  4 Sensitive data can't just live in a plain file

                                  Problem

                                  Solution

                                  5 Stock prices and P&L need to stay current

                                  Problem

                                  Solution

                                  6 Insurance and investment data shouldn't be lumped together

                                  Problem

                                  Solution

                                  Demo

                                  Unlock
                                  Unlock screen
                                  Unlock Screen — Face ID / passcode unlock; the on-screen copy explains that data only decrypts on this device and backups never store plaintext
                                  Financial Overview
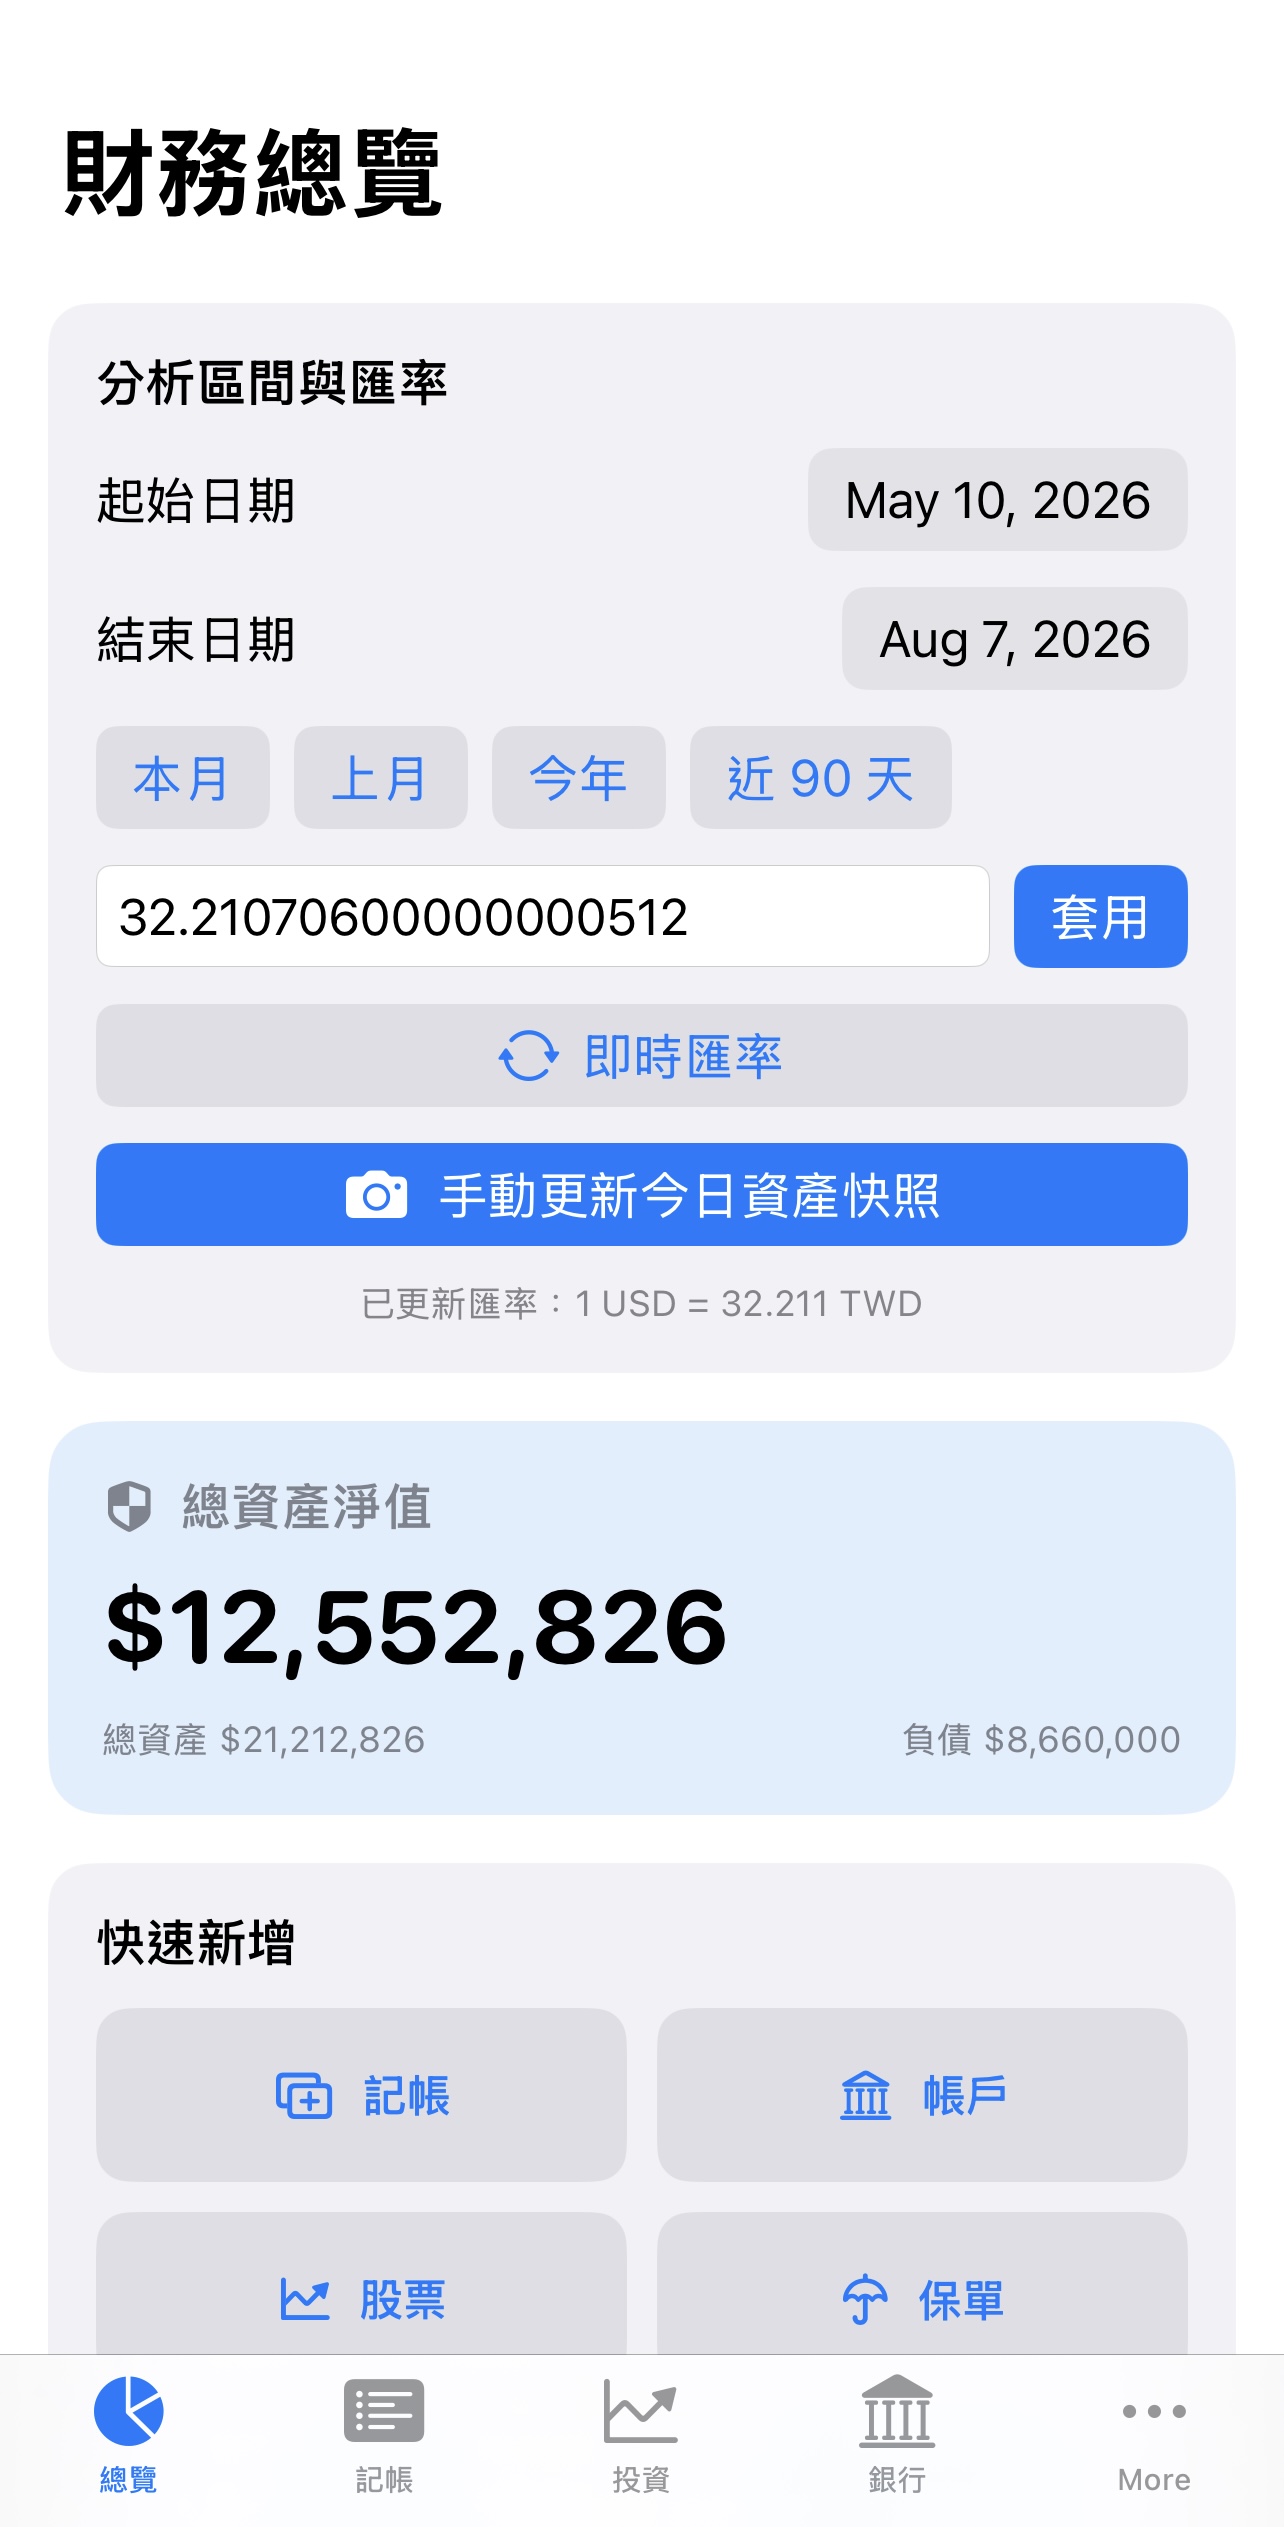
                                  Date range and snapshot
                                  Date Range & Snapshot — pick an analysis period (this month / last month / this year / last 90 days) with a live exchange rate, a net worth KPI, and a one-tap button to save today's asset snapshot
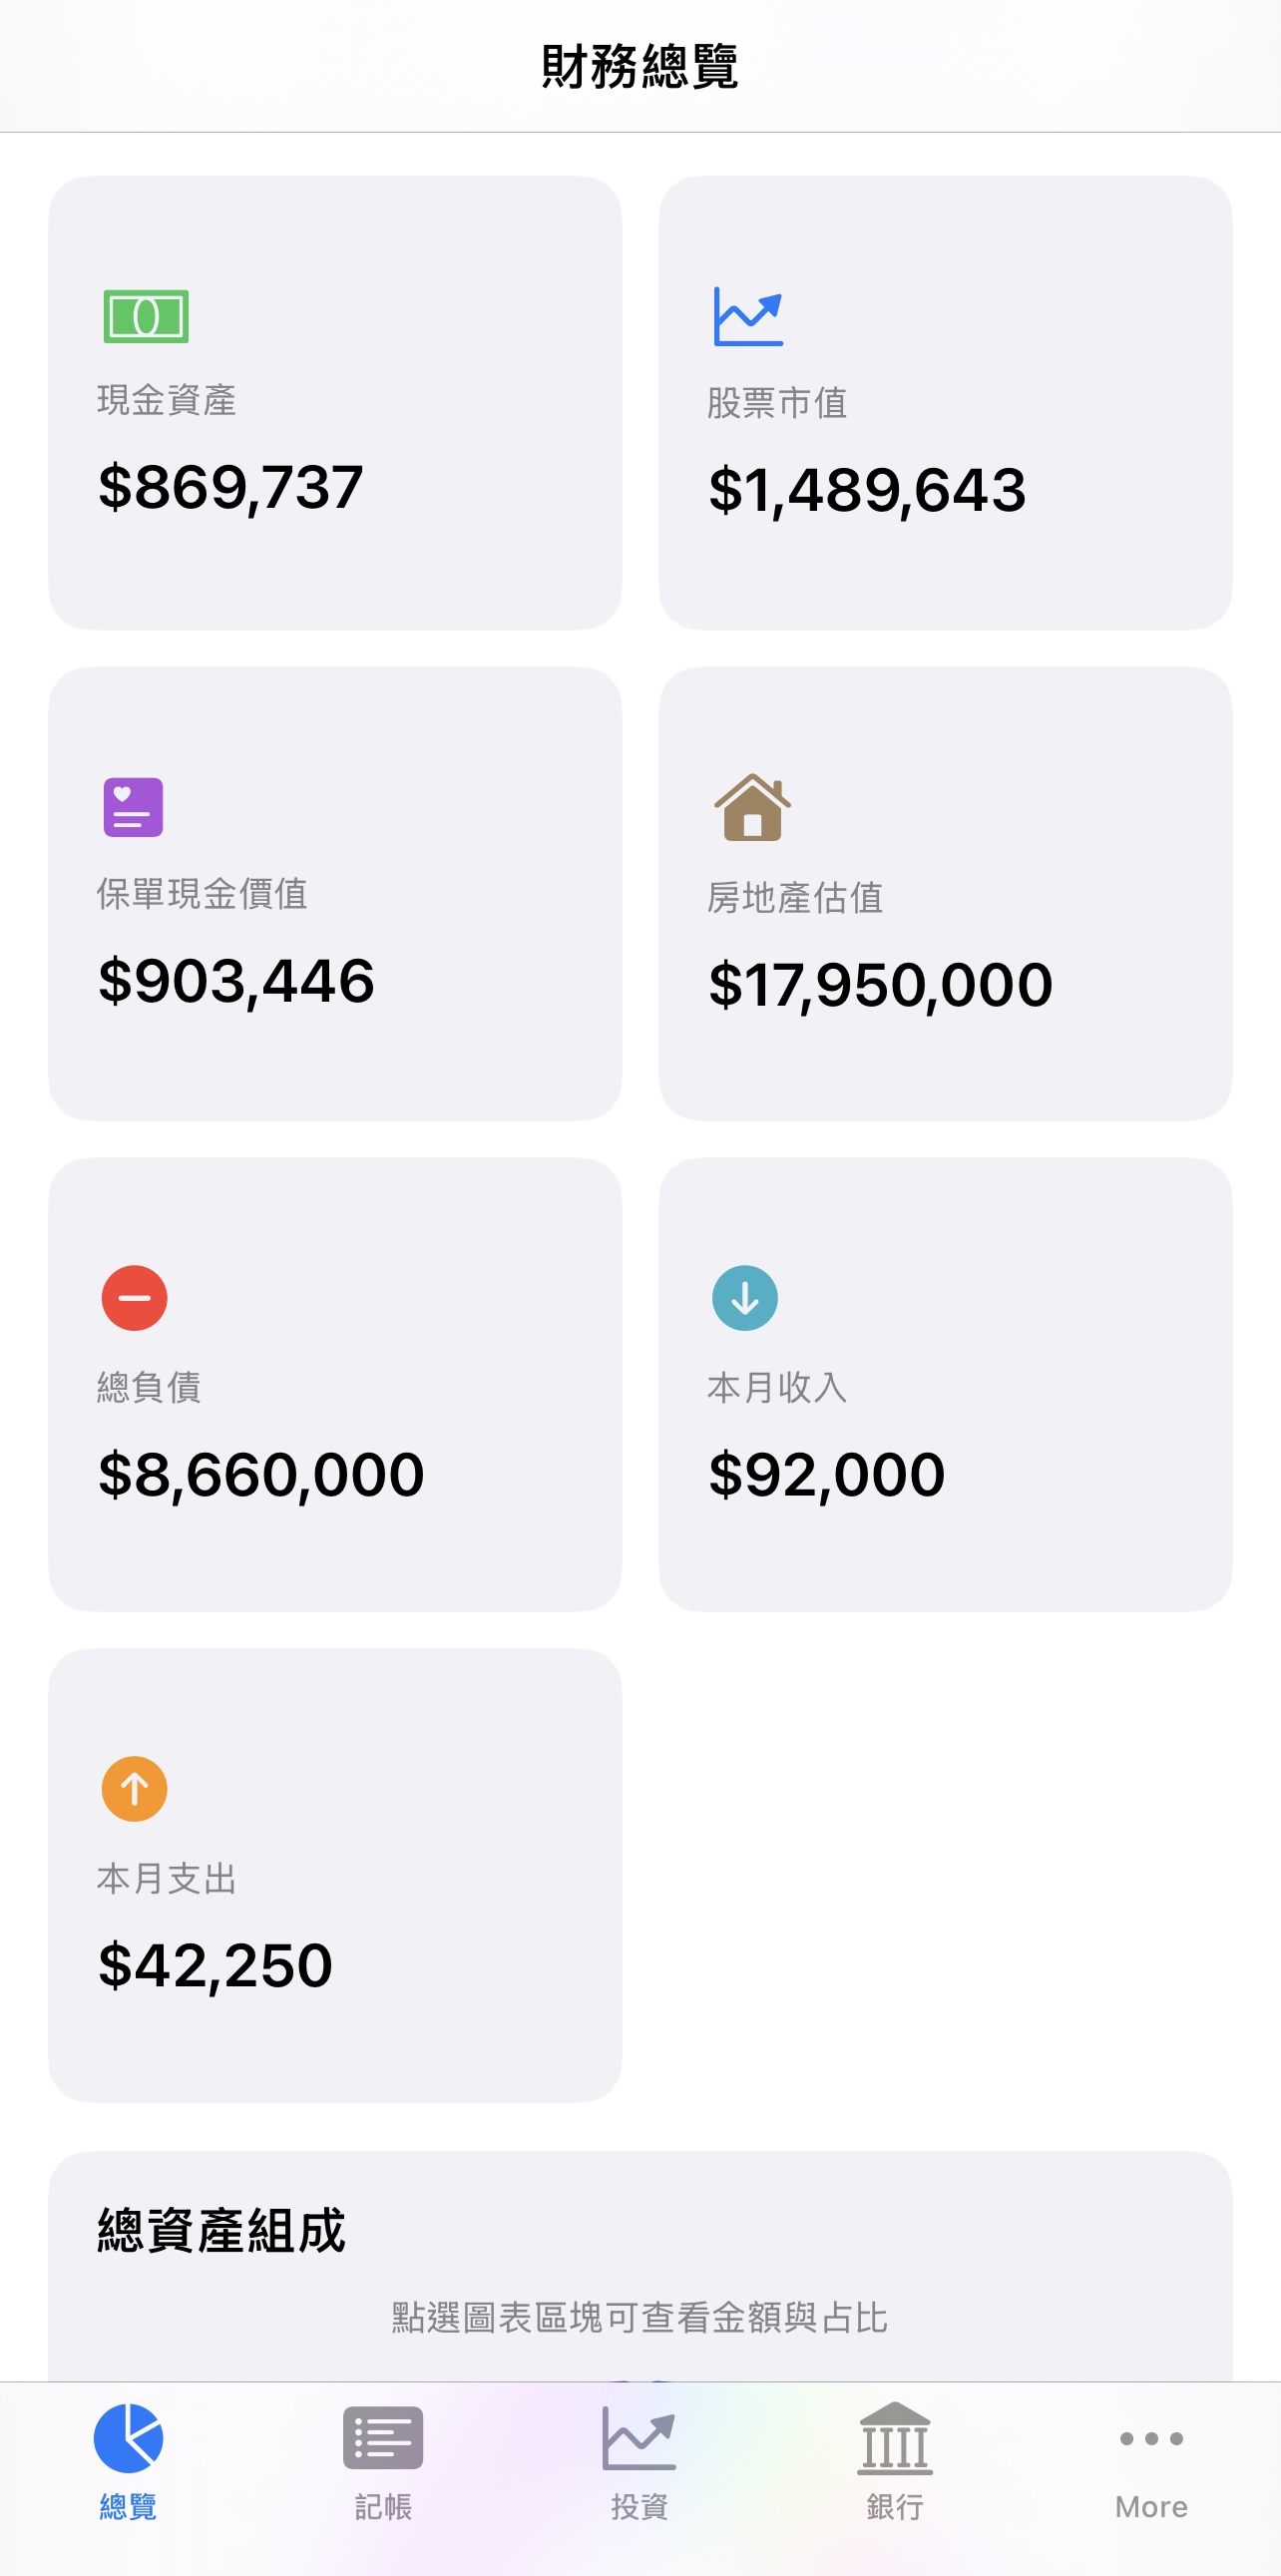
                                  Overview KPI cards
                                  Overview KPI Cards — cash, stock value, policy cash value, real estate value, total liabilities, this month's income and expenses
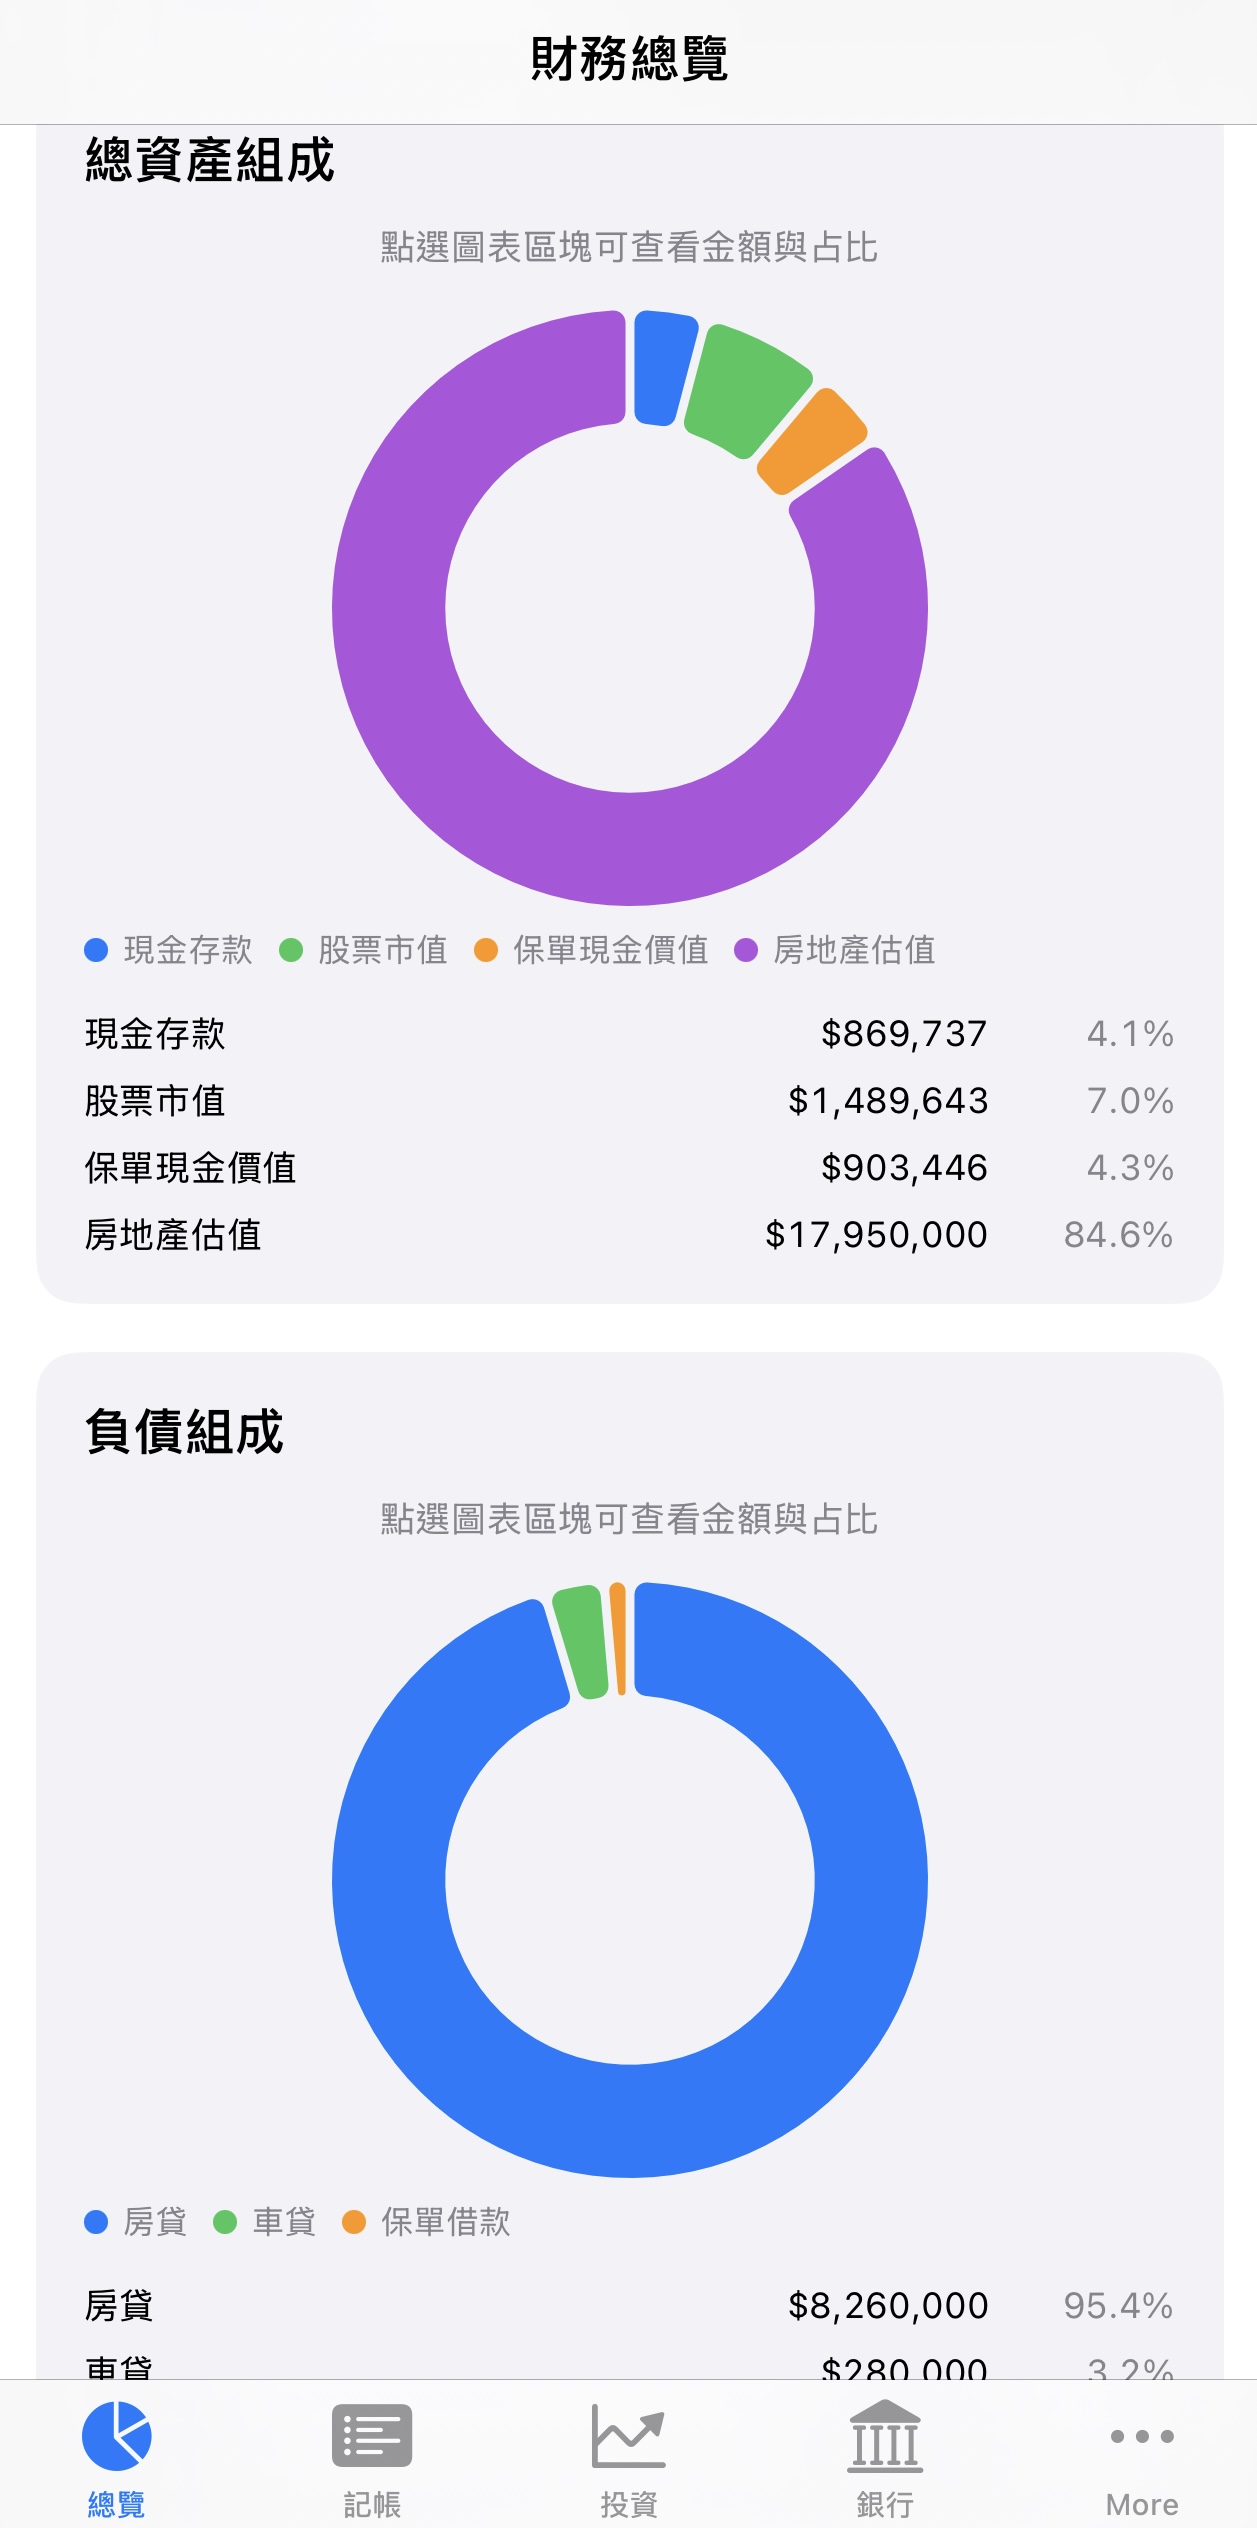
                                  Asset and liability composition
                                  Asset & Liability Composition — donut charts breaking down total assets and total liabilities; tap a slice to see its amount and share
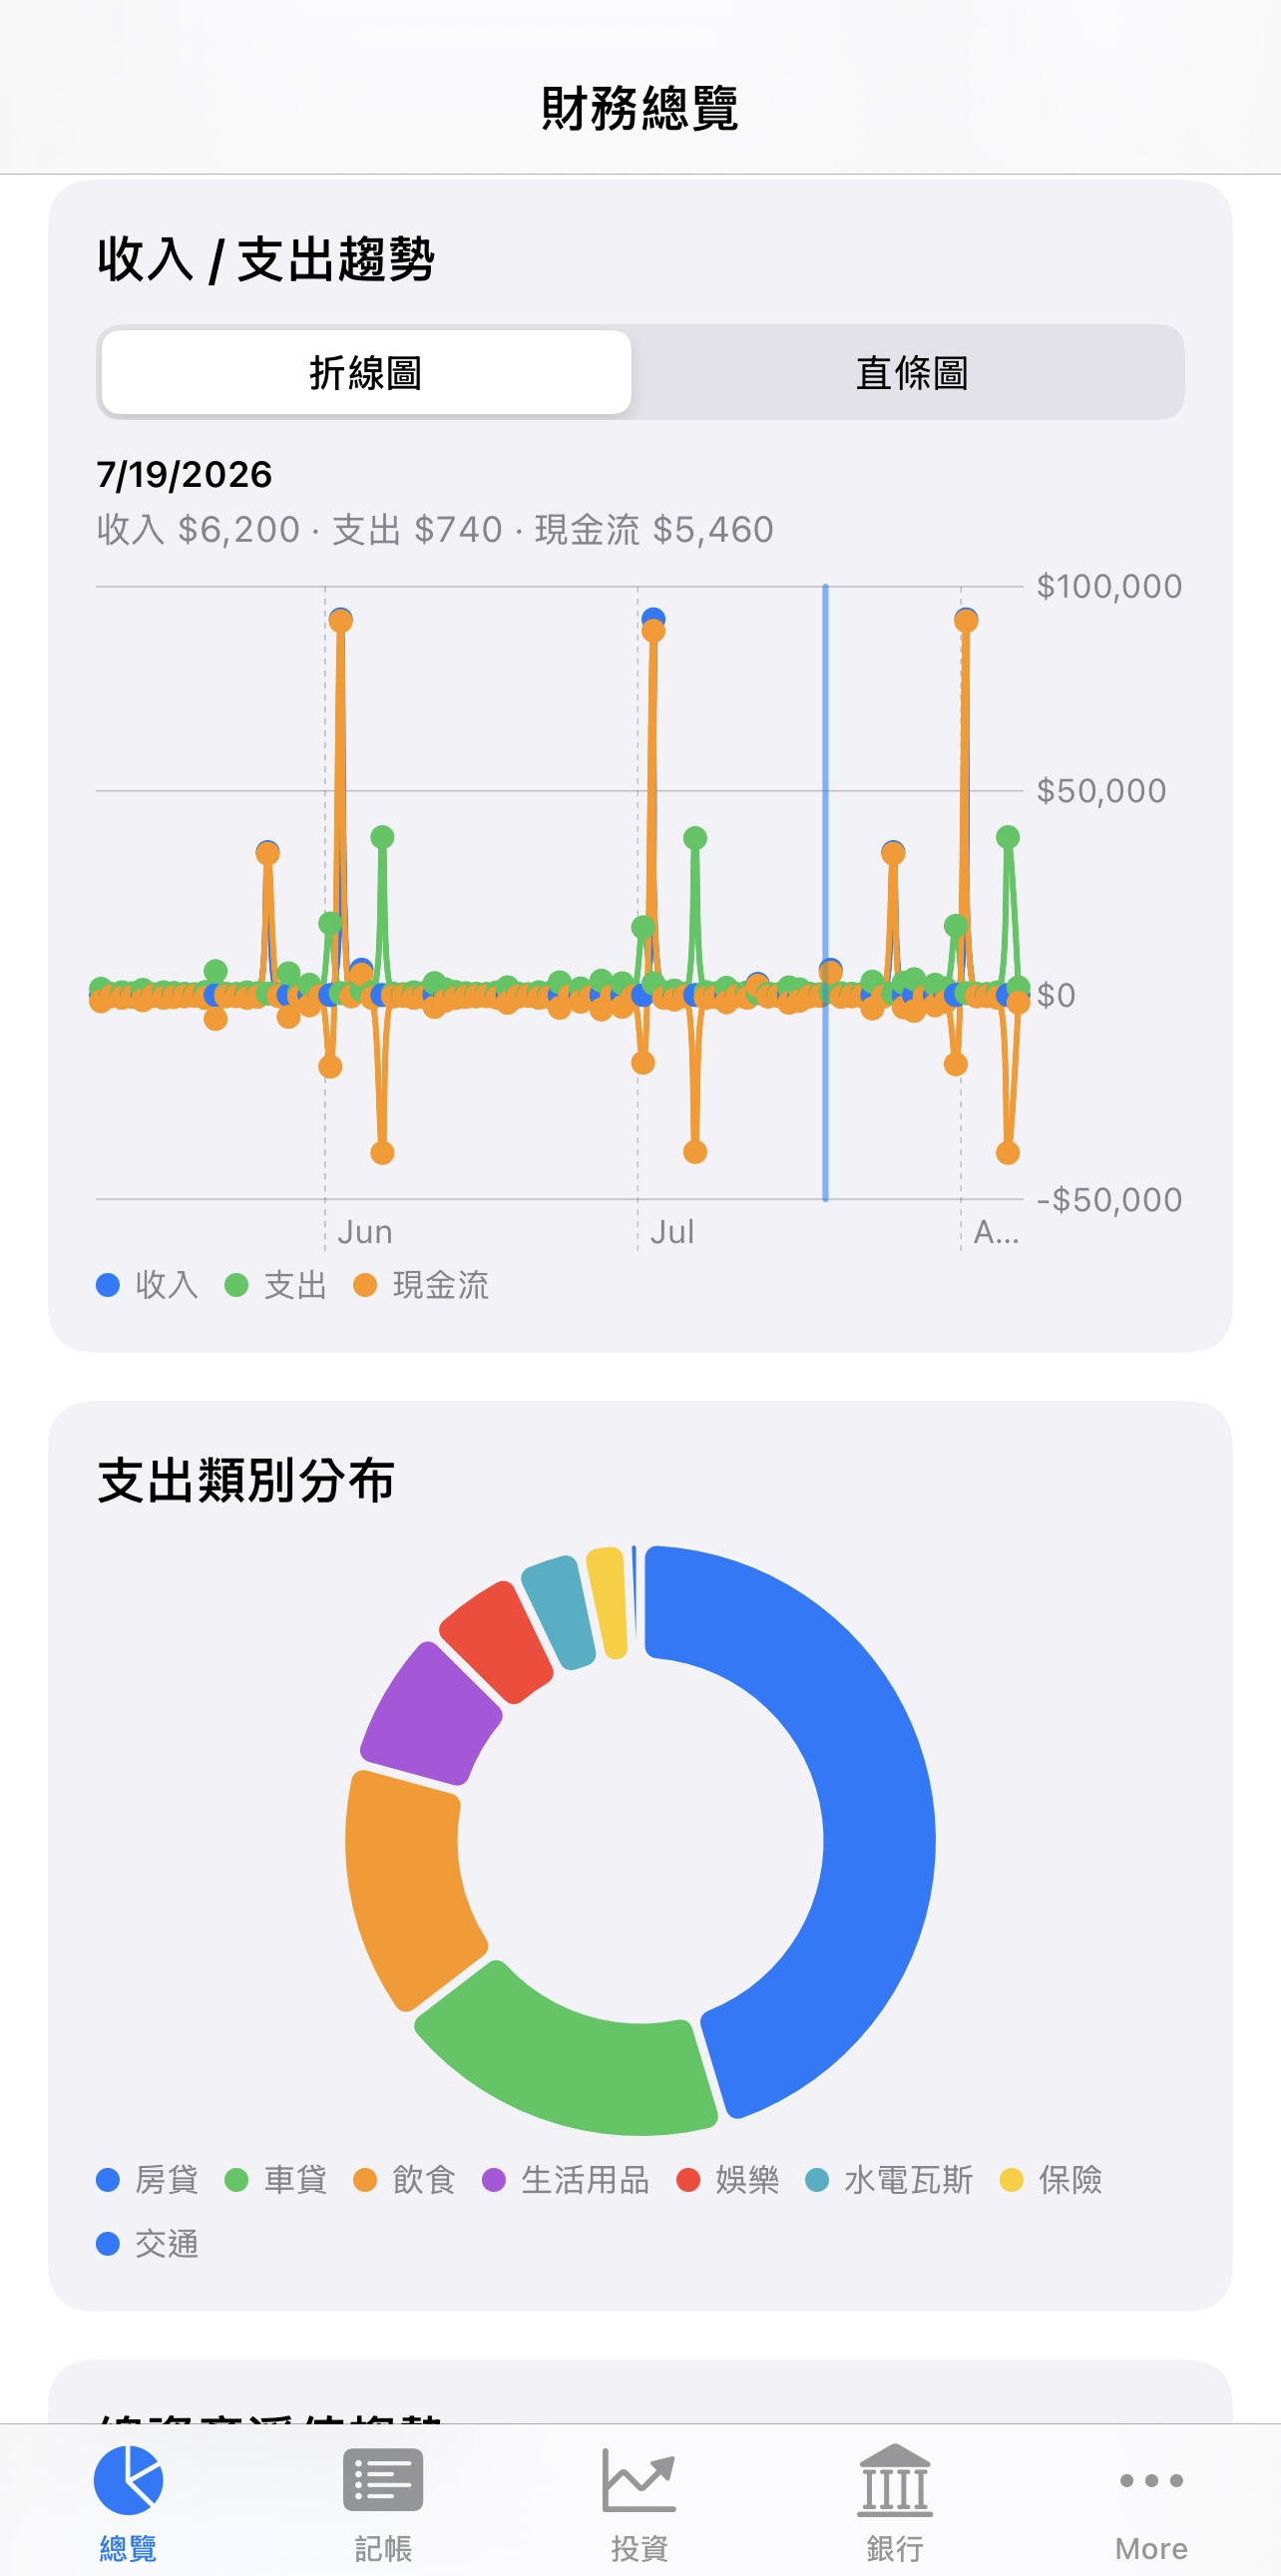
                                  Income and expense trend
                                  Income/Expense Trend & Spending Breakdown — switch between line and bar charts for income vs. expenses, plus a spending-by-category donut chart
                                  Daily Expense Tracking
                                  Transaction list
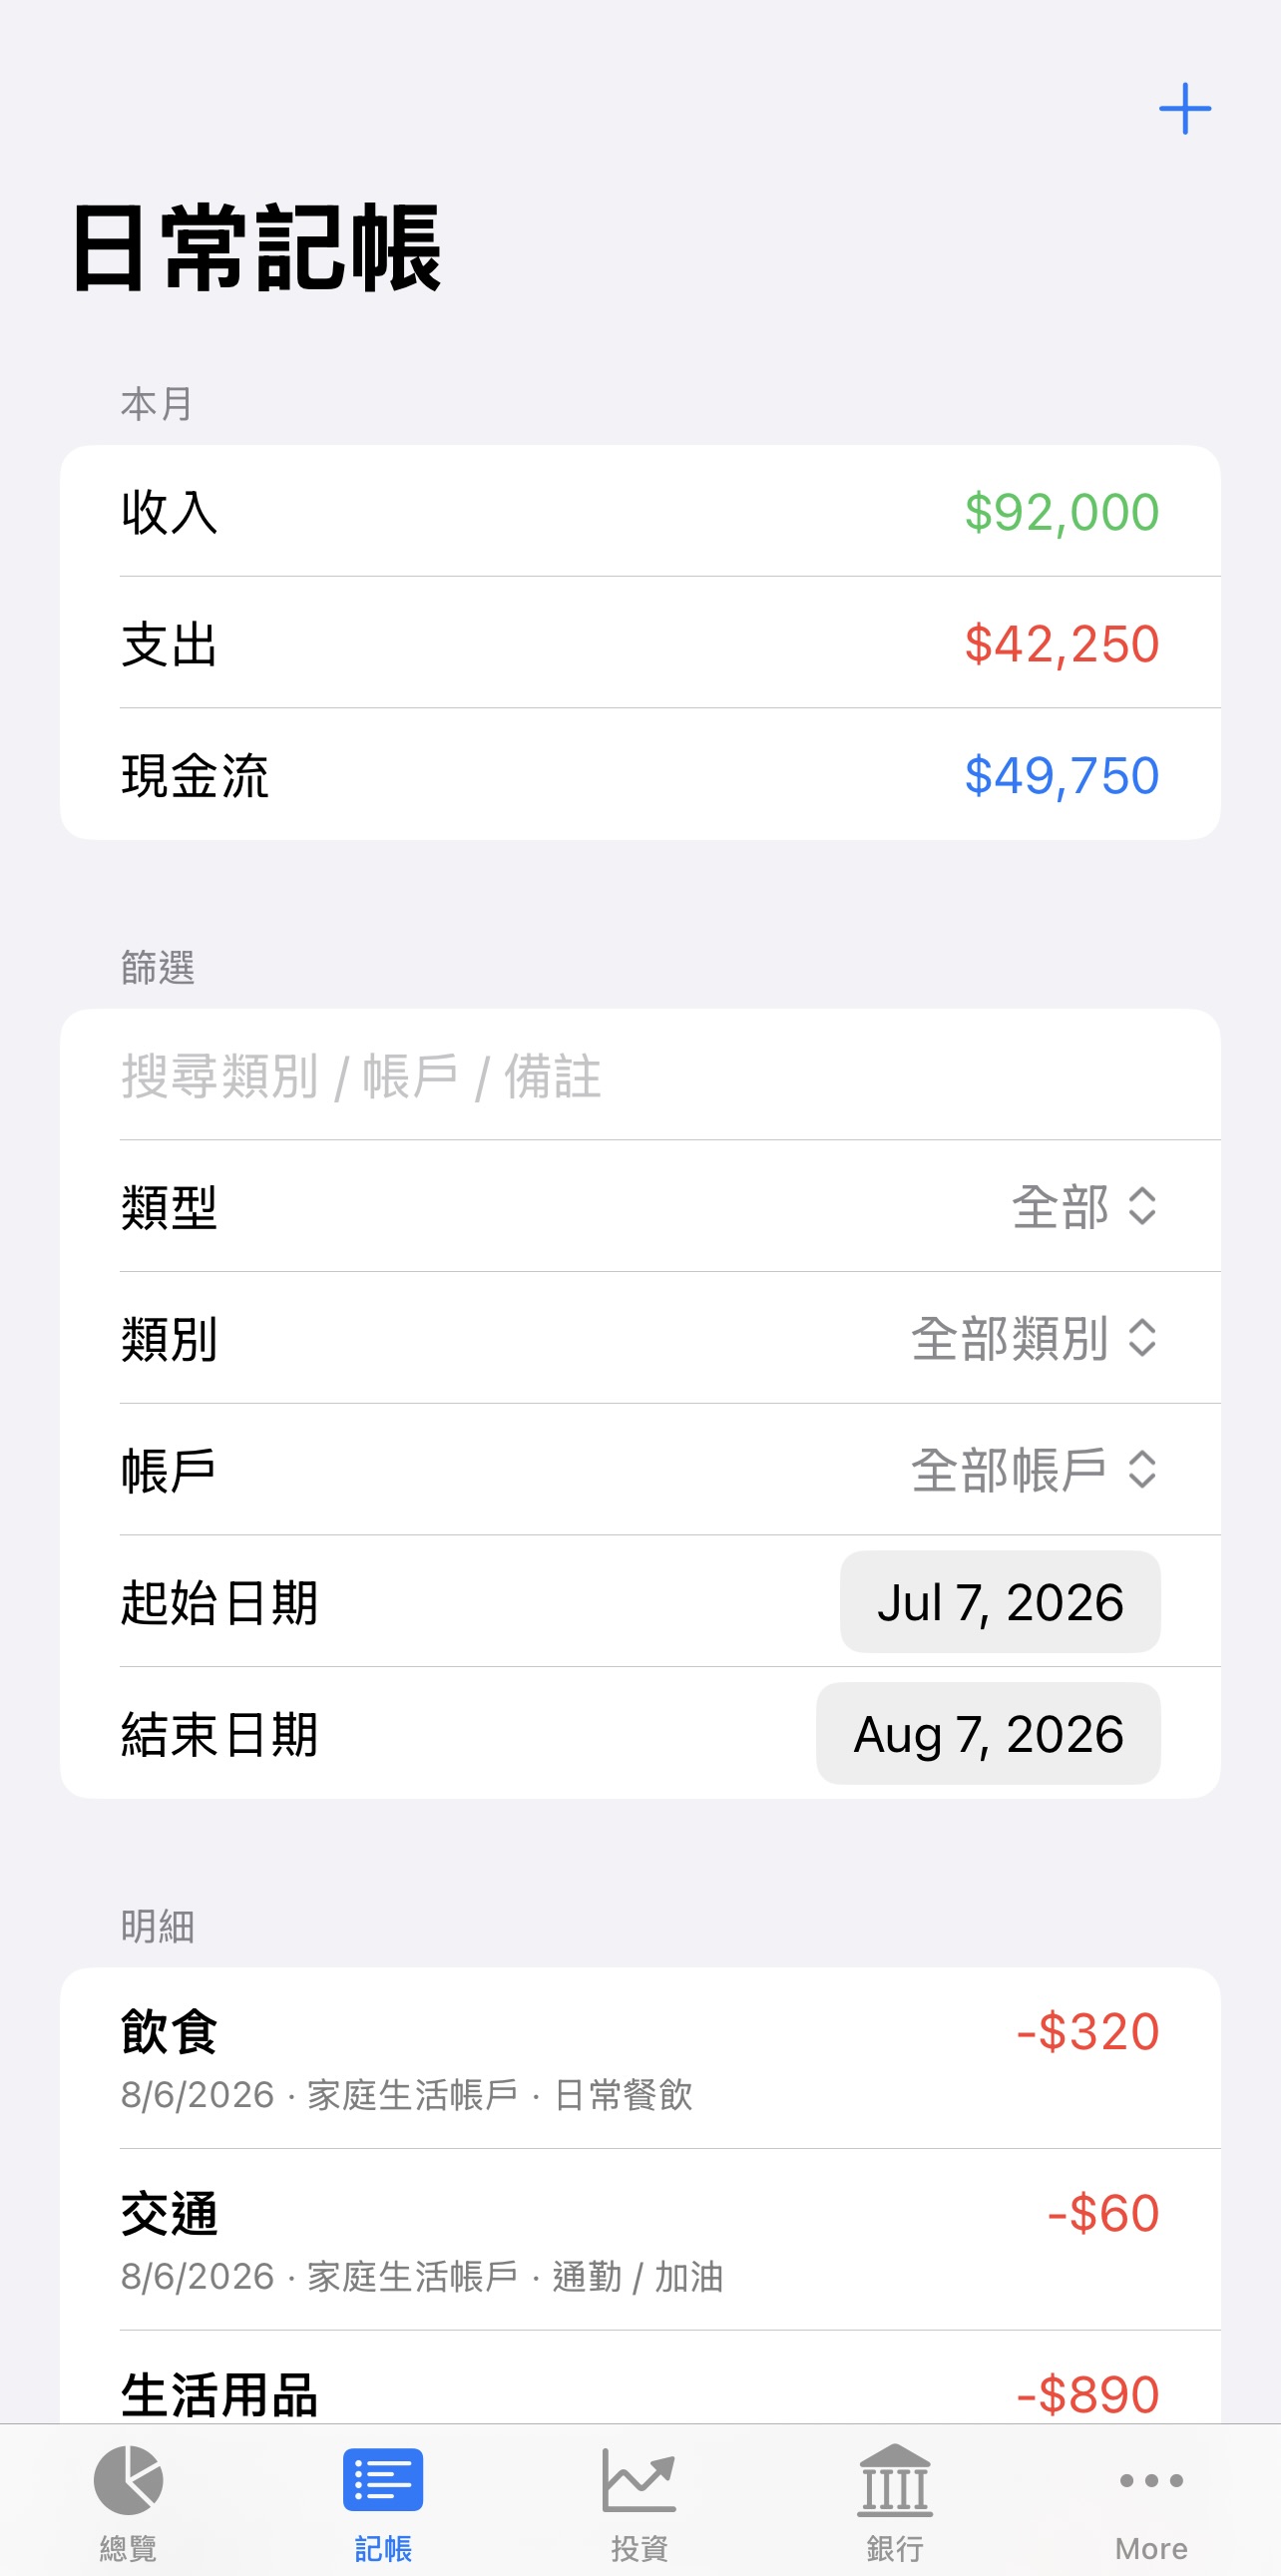
                                  Transaction List — this month's income, expenses and cash flow, with filters by type / category / account / date and a searchable transaction list
                                  Add a transaction
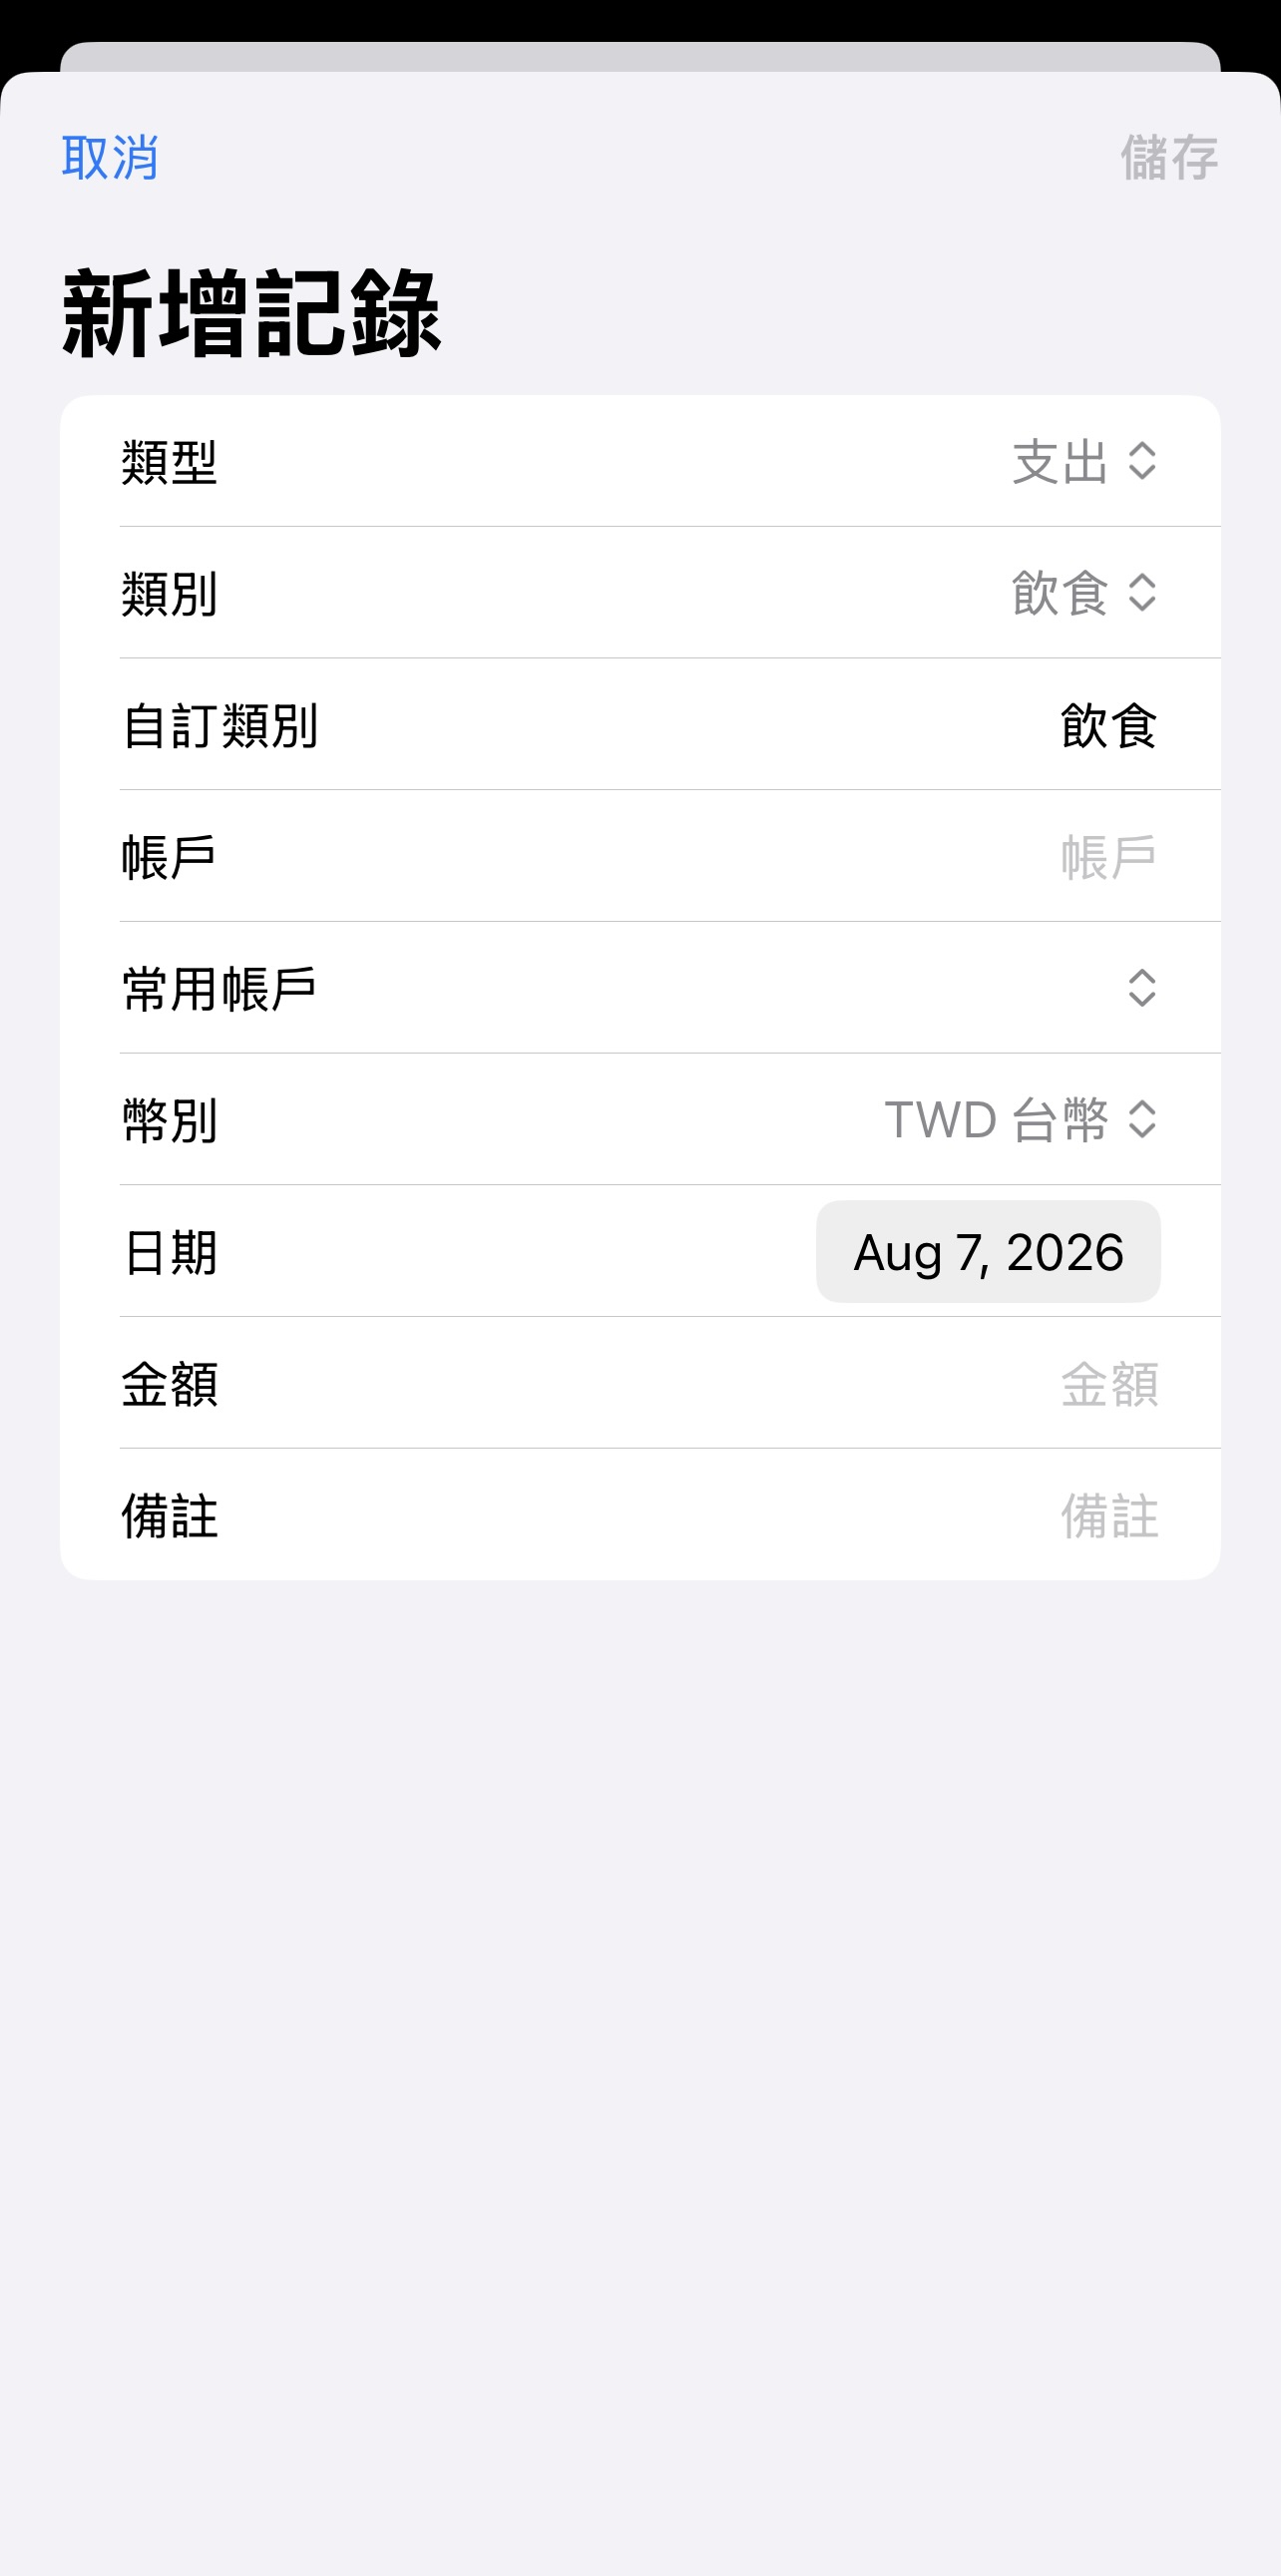
                                  Add a Transaction — type, category (or a custom one you type in), account, currency, date, amount and notes
                                  Stock Investment
                                  Taiwan stock P&L panel
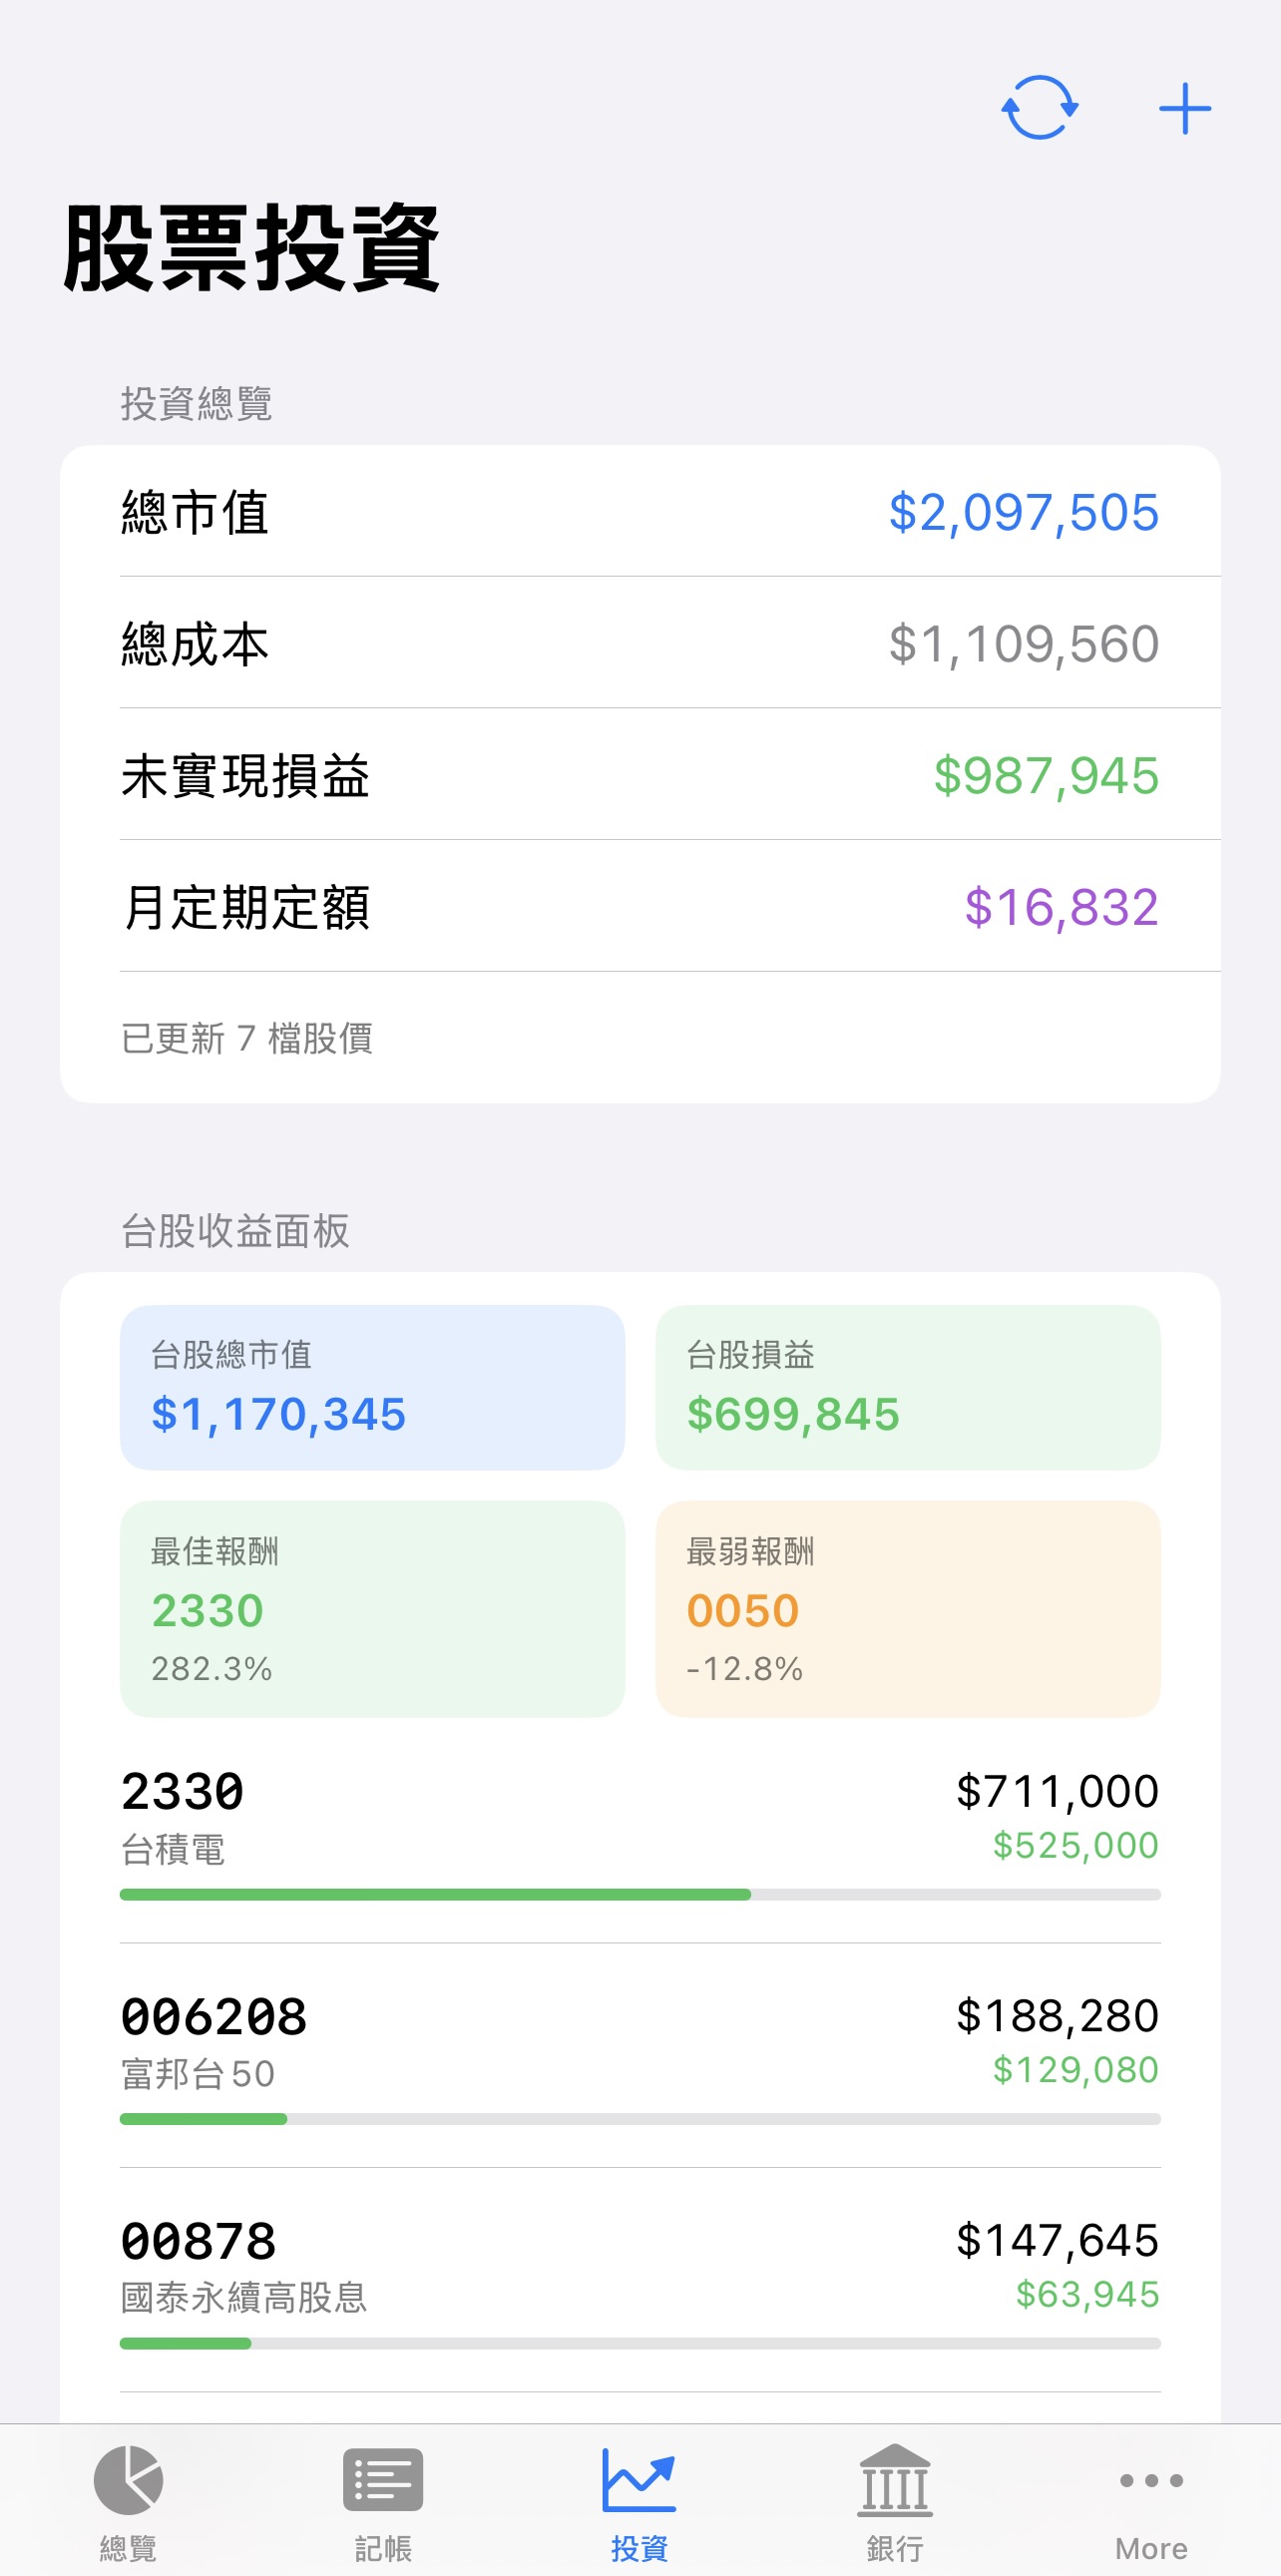
                                  Taiwan Stock P&L Panel — total value, total cost, unrealized P&L and monthly DCA amount, plus a Taiwan-market panel showing the best/worst performer
                                  US stock P&L panel
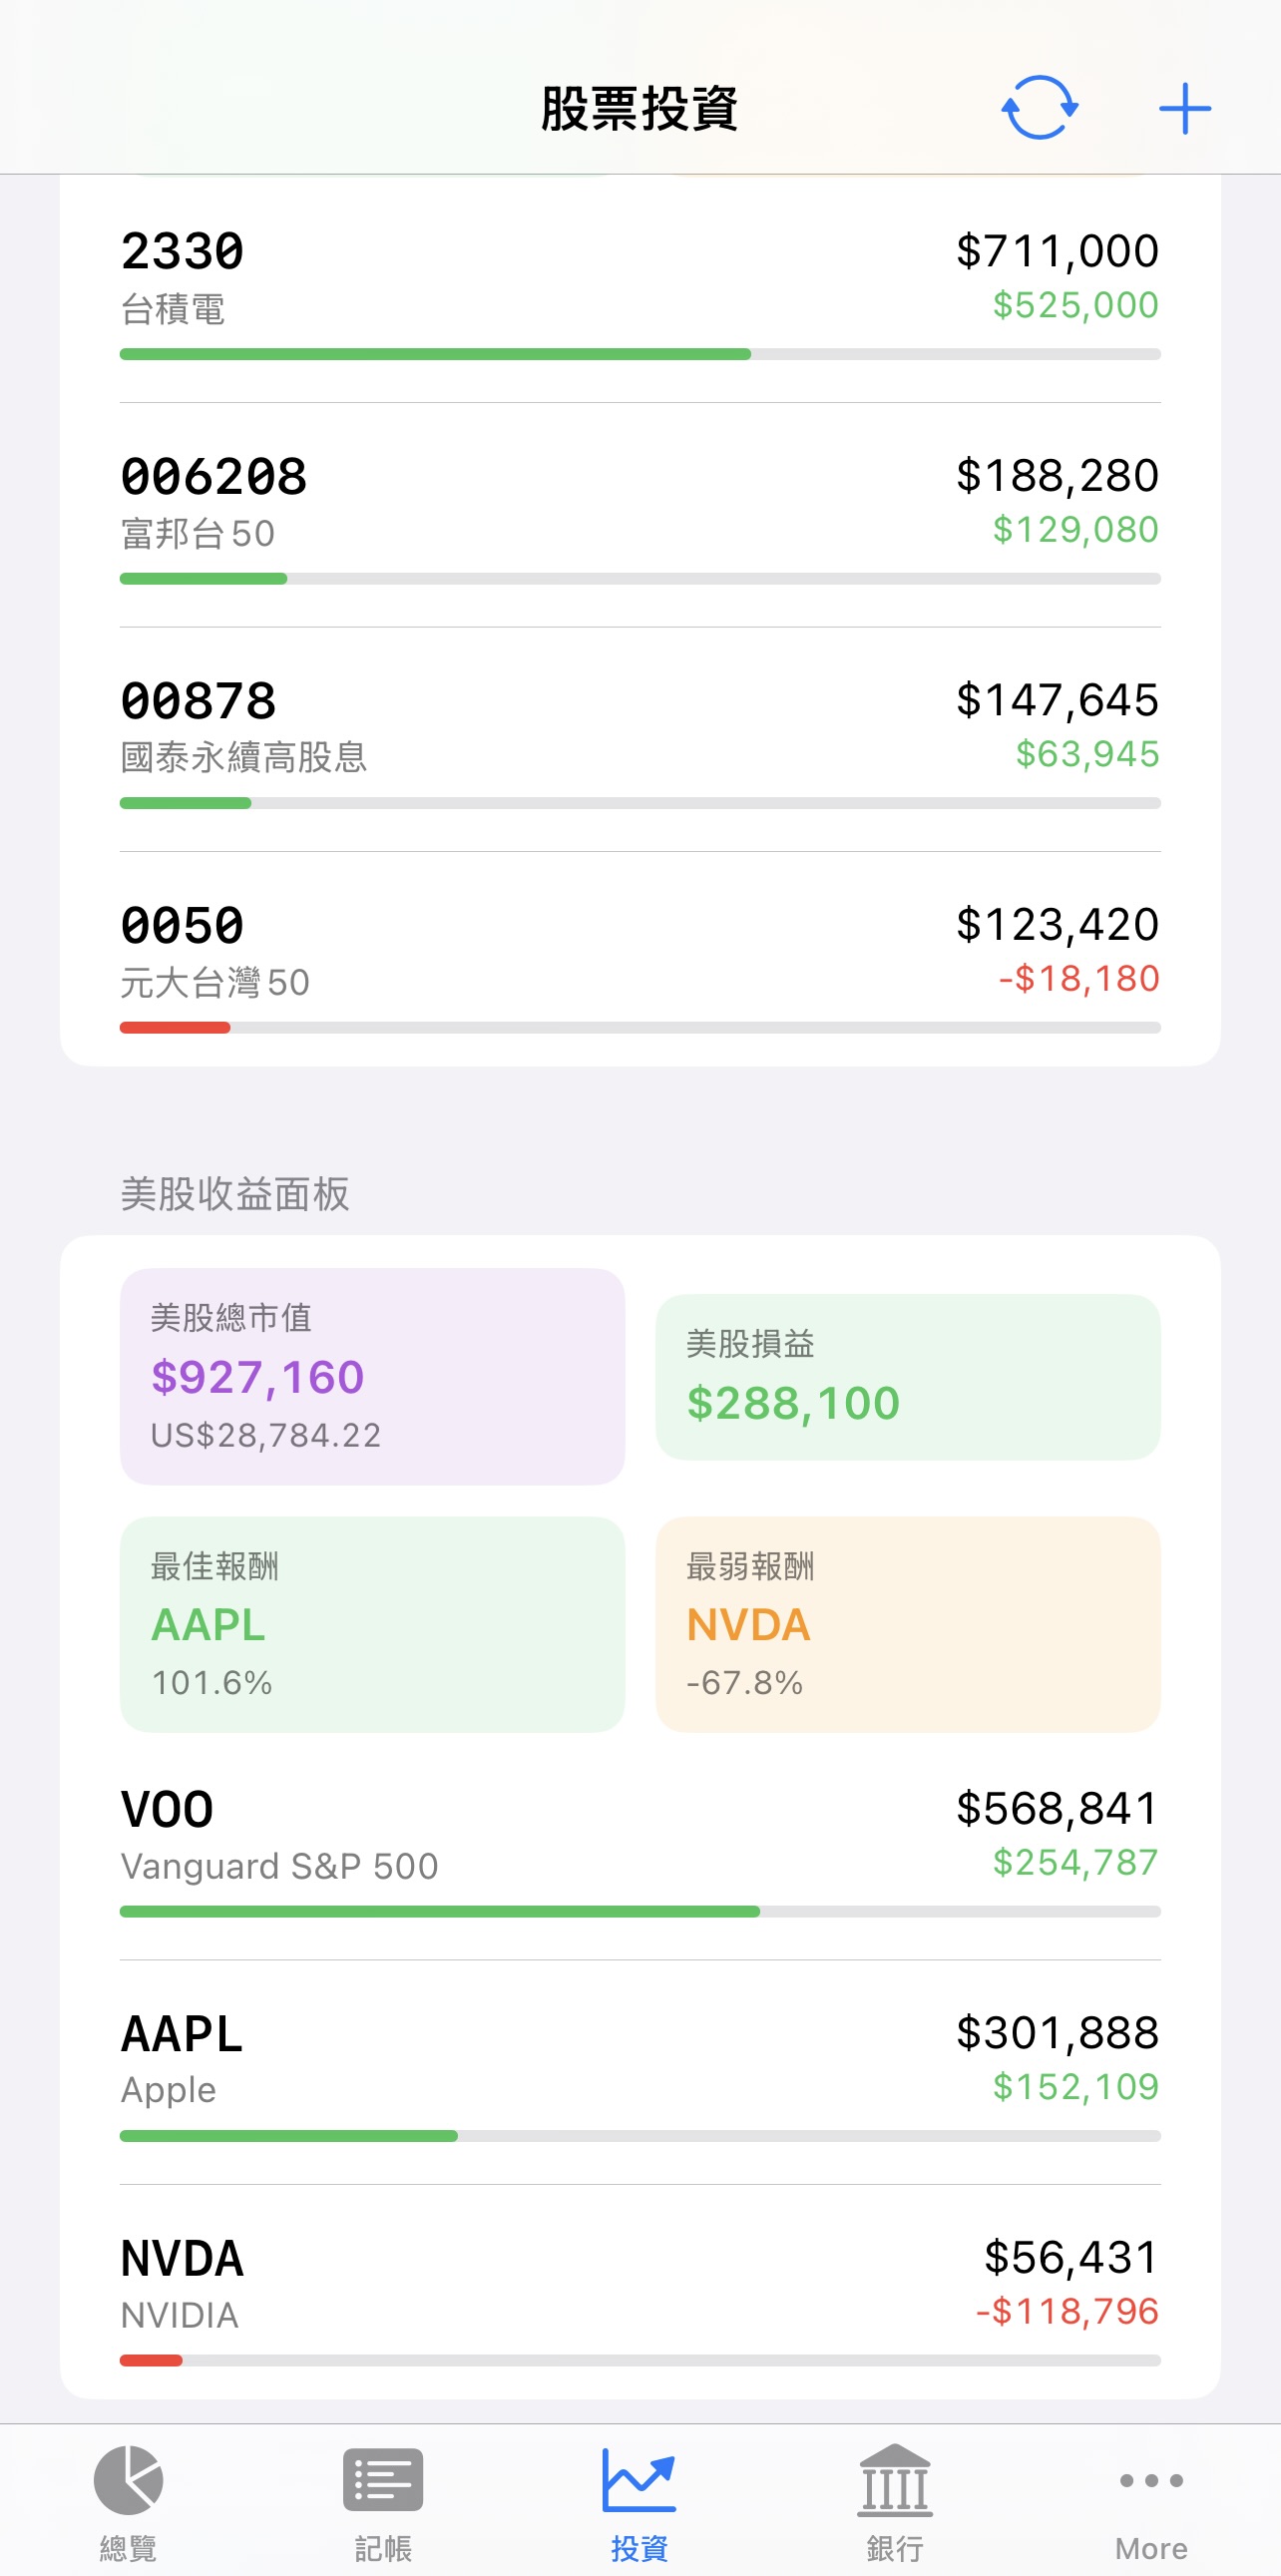
                                  US Stock P&L Panel — the same breakdown for US holdings, converted and shown in TWD
                                  Holdings detail
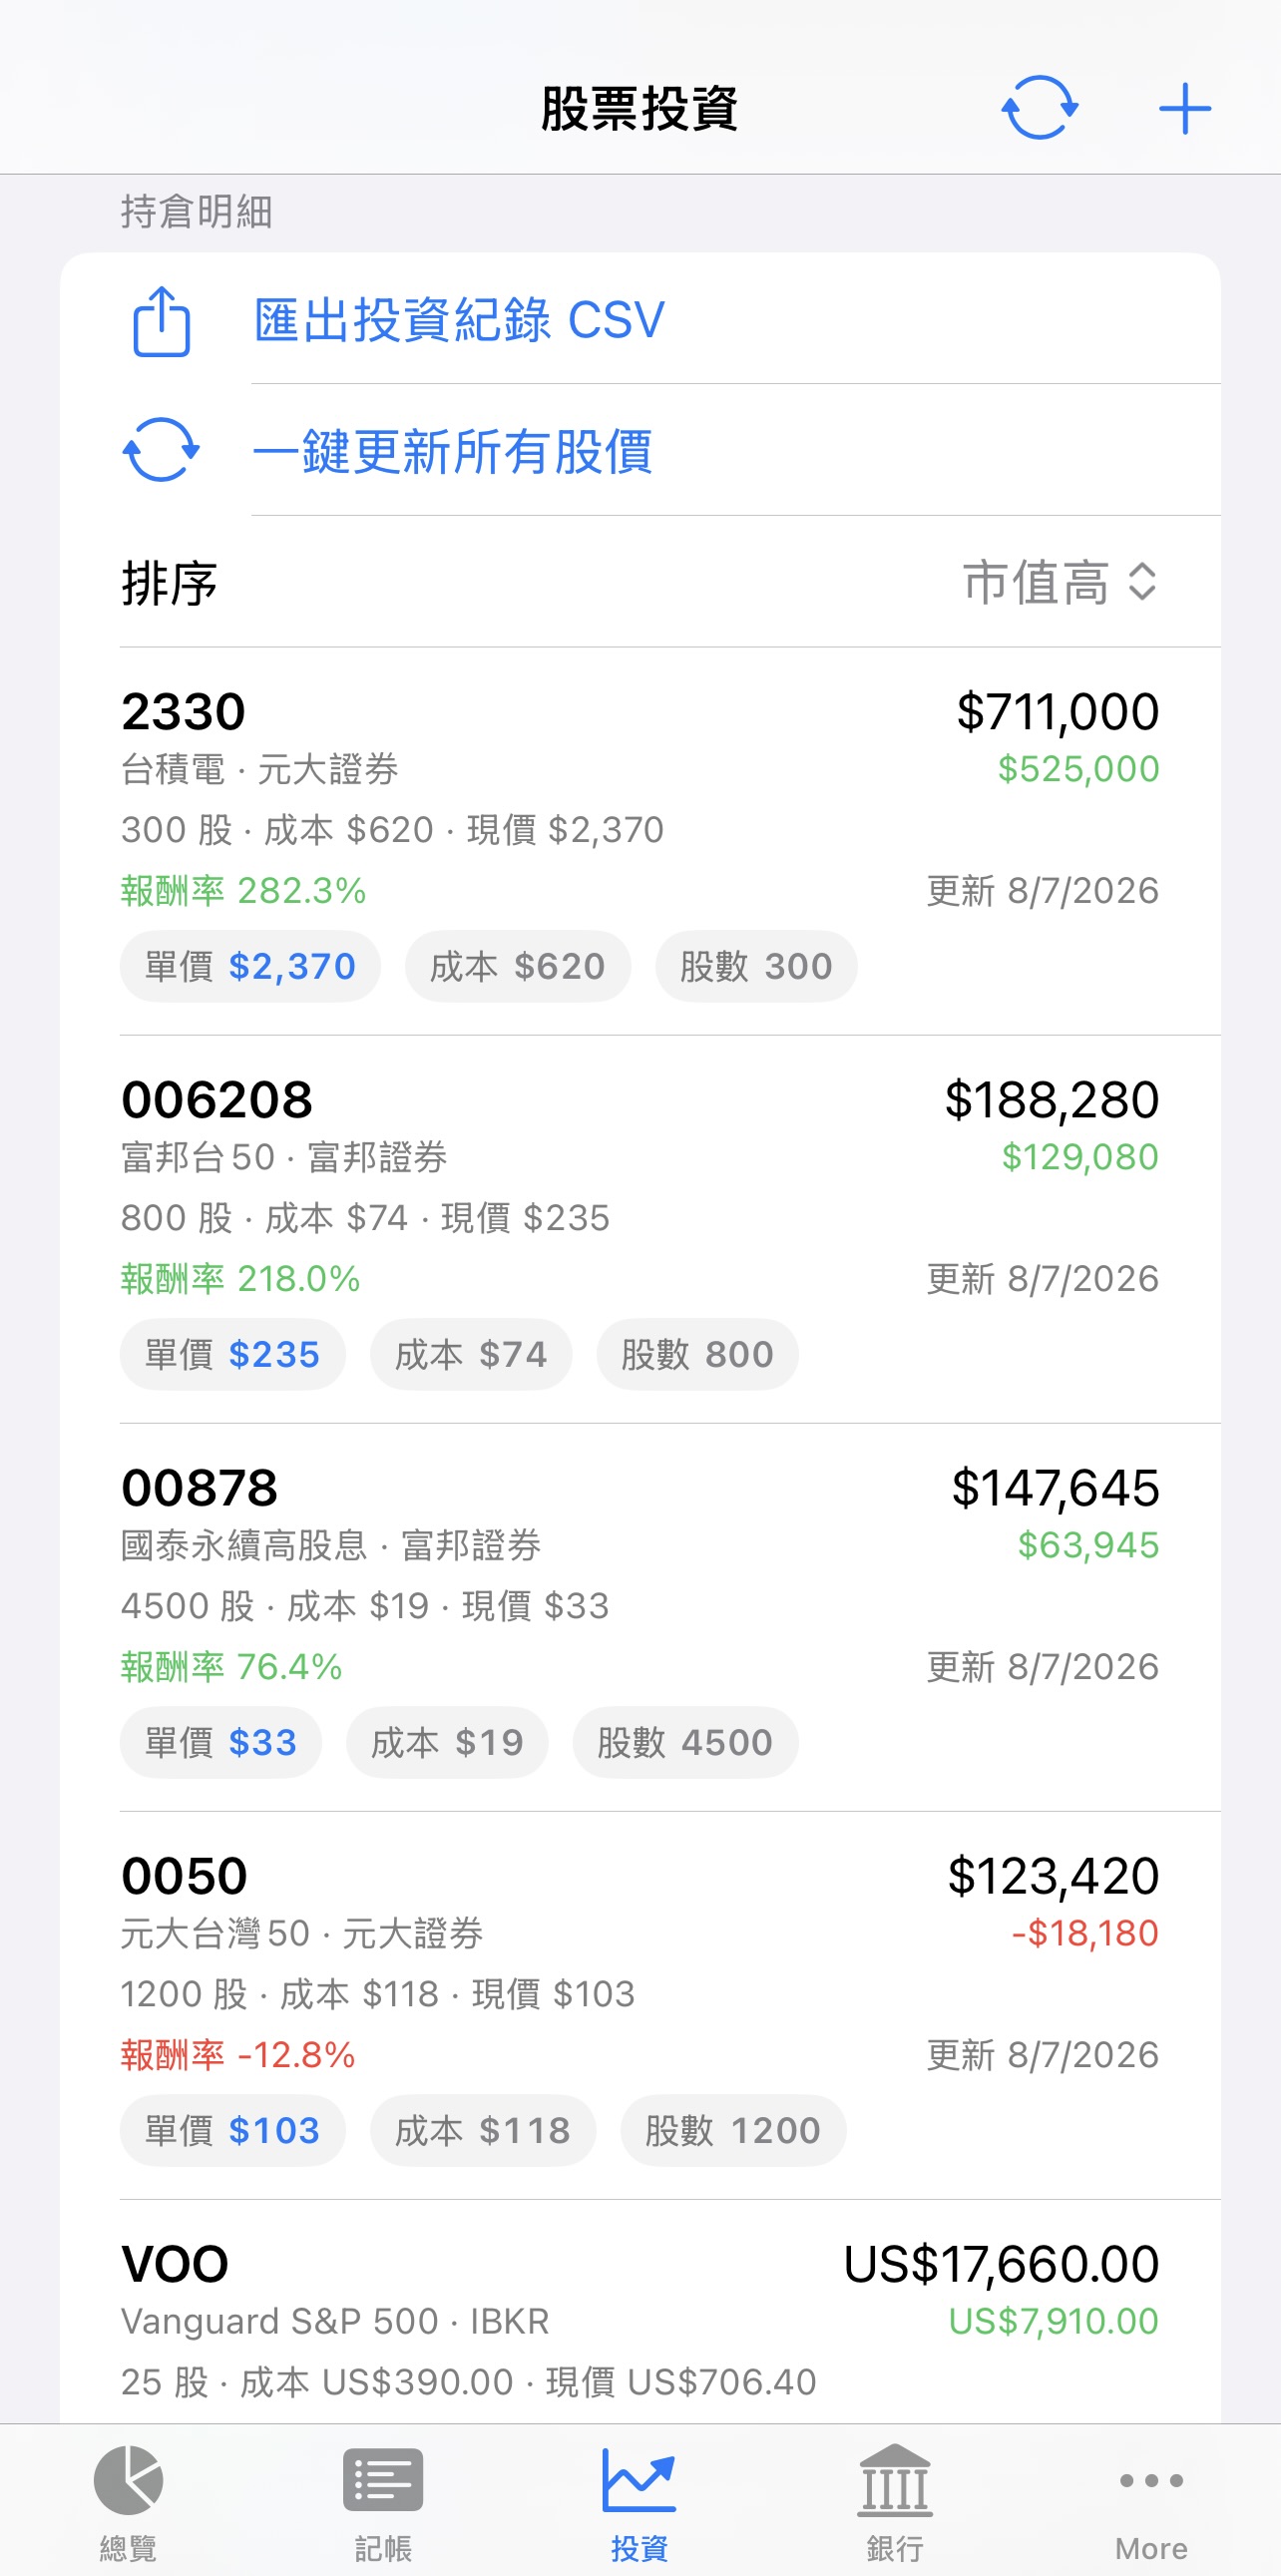
                                  Holdings Detail — per-ticker shares, cost, current price and return rate, with one-tap price refresh and CSV export
                                  Market allocation
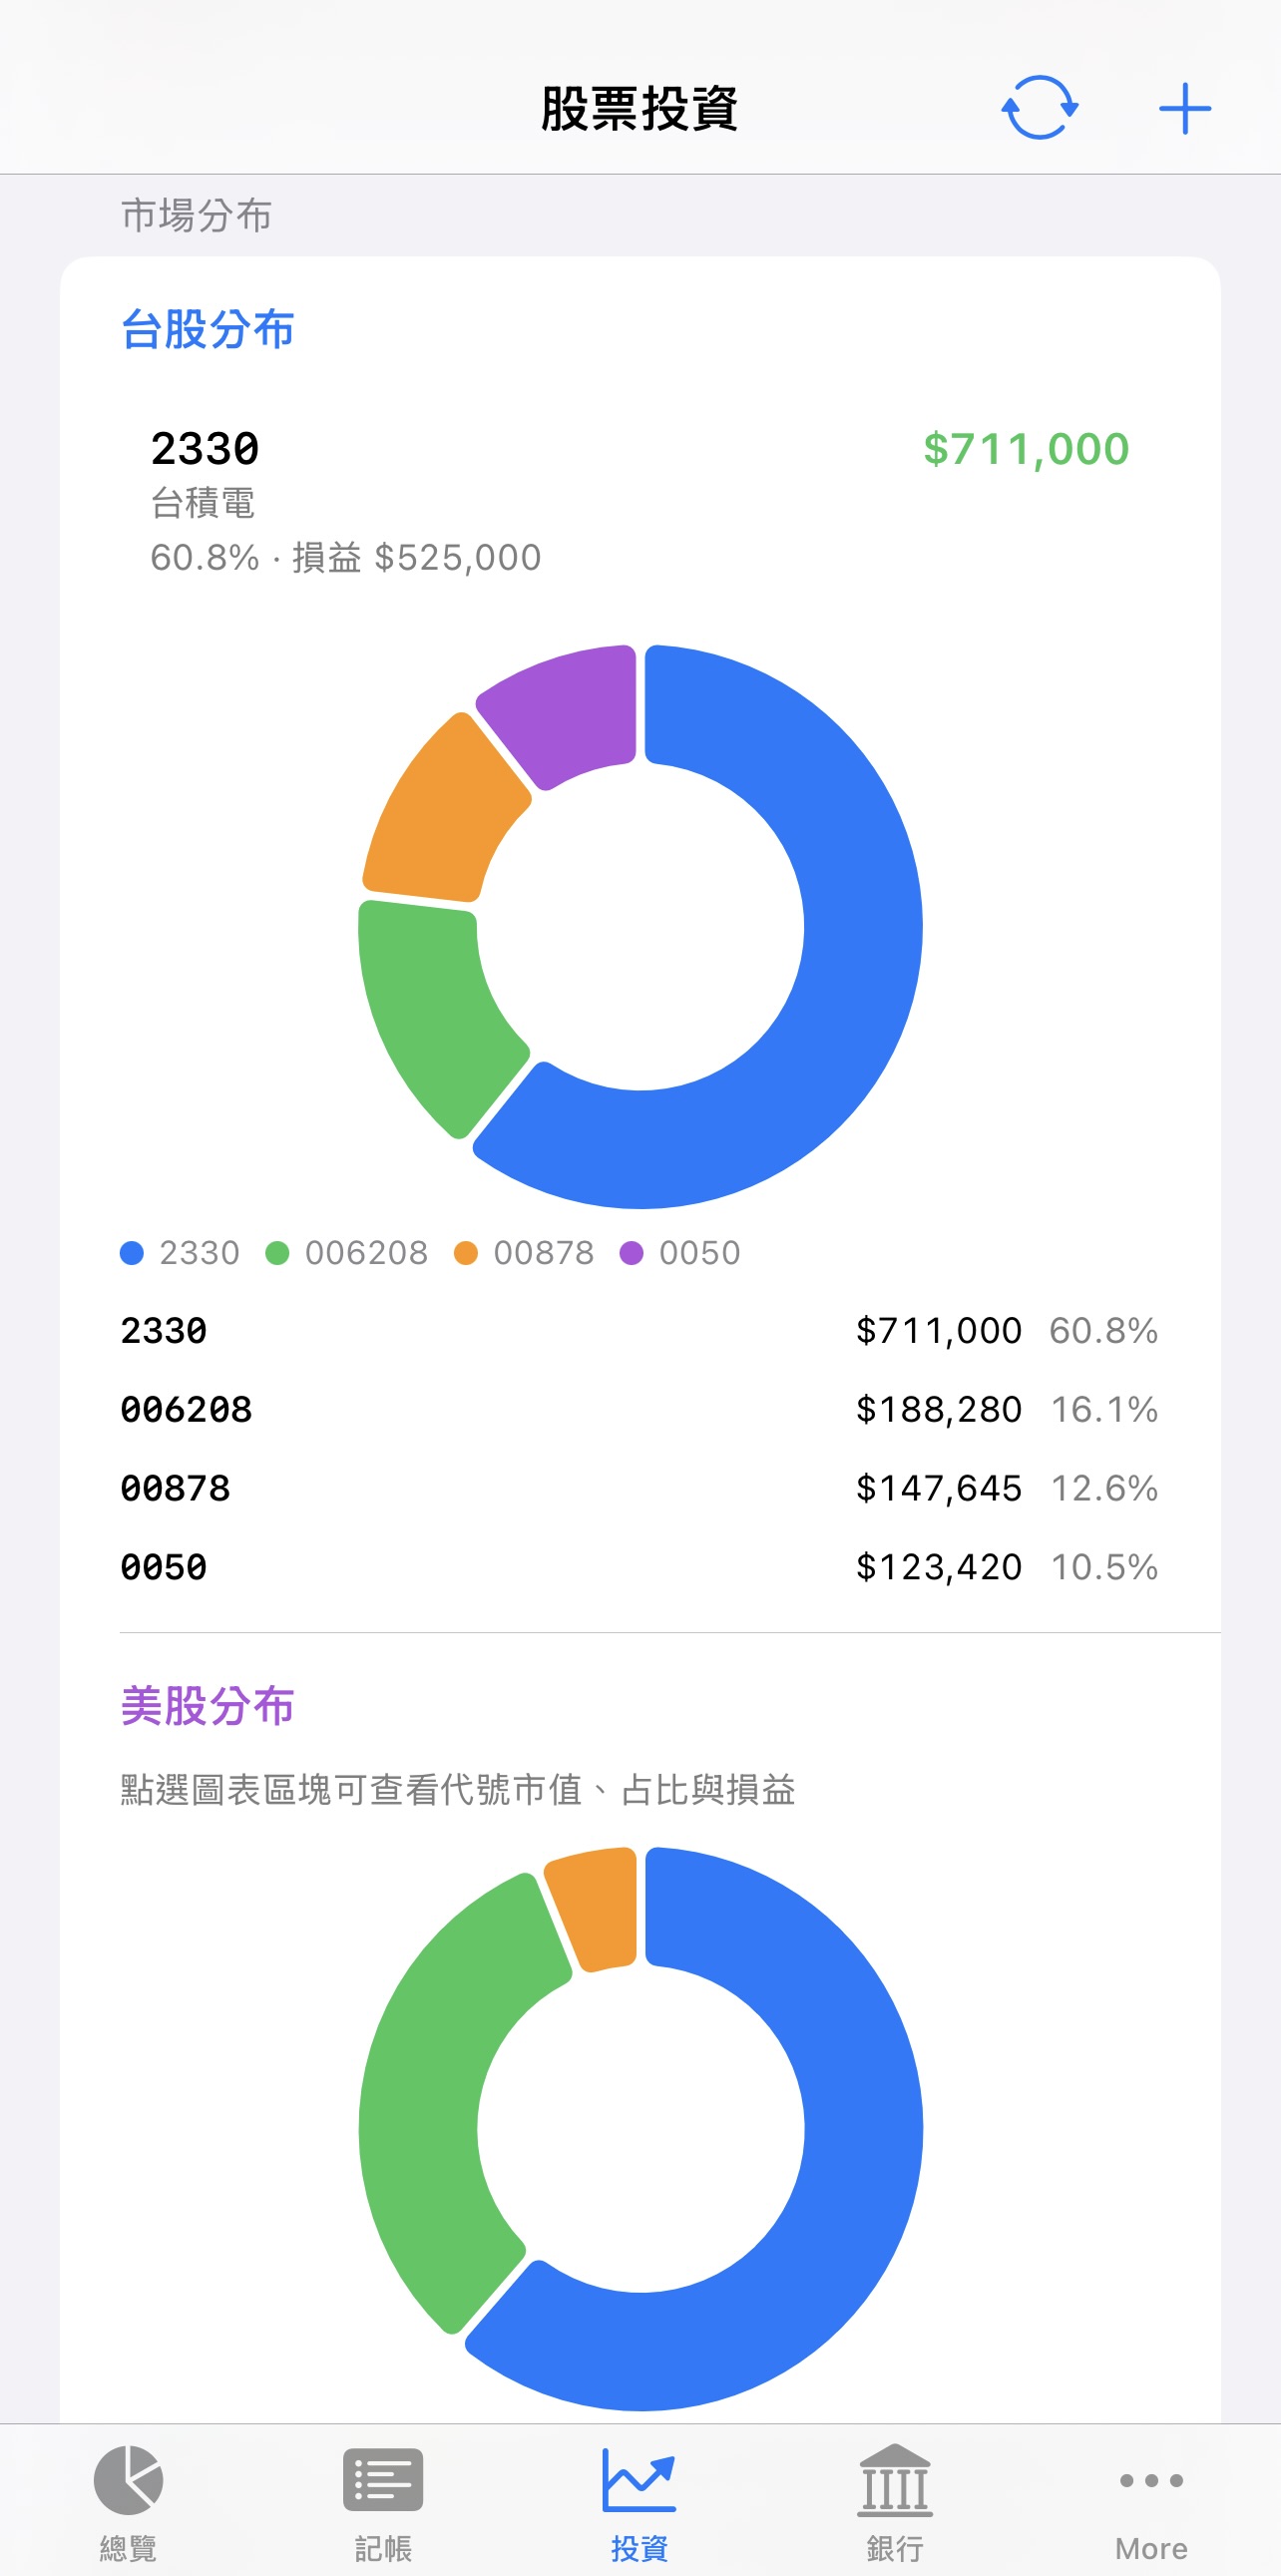
                                  Market Allocation — separate donut charts for Taiwan-market and US-market weight
                                  P&L trend
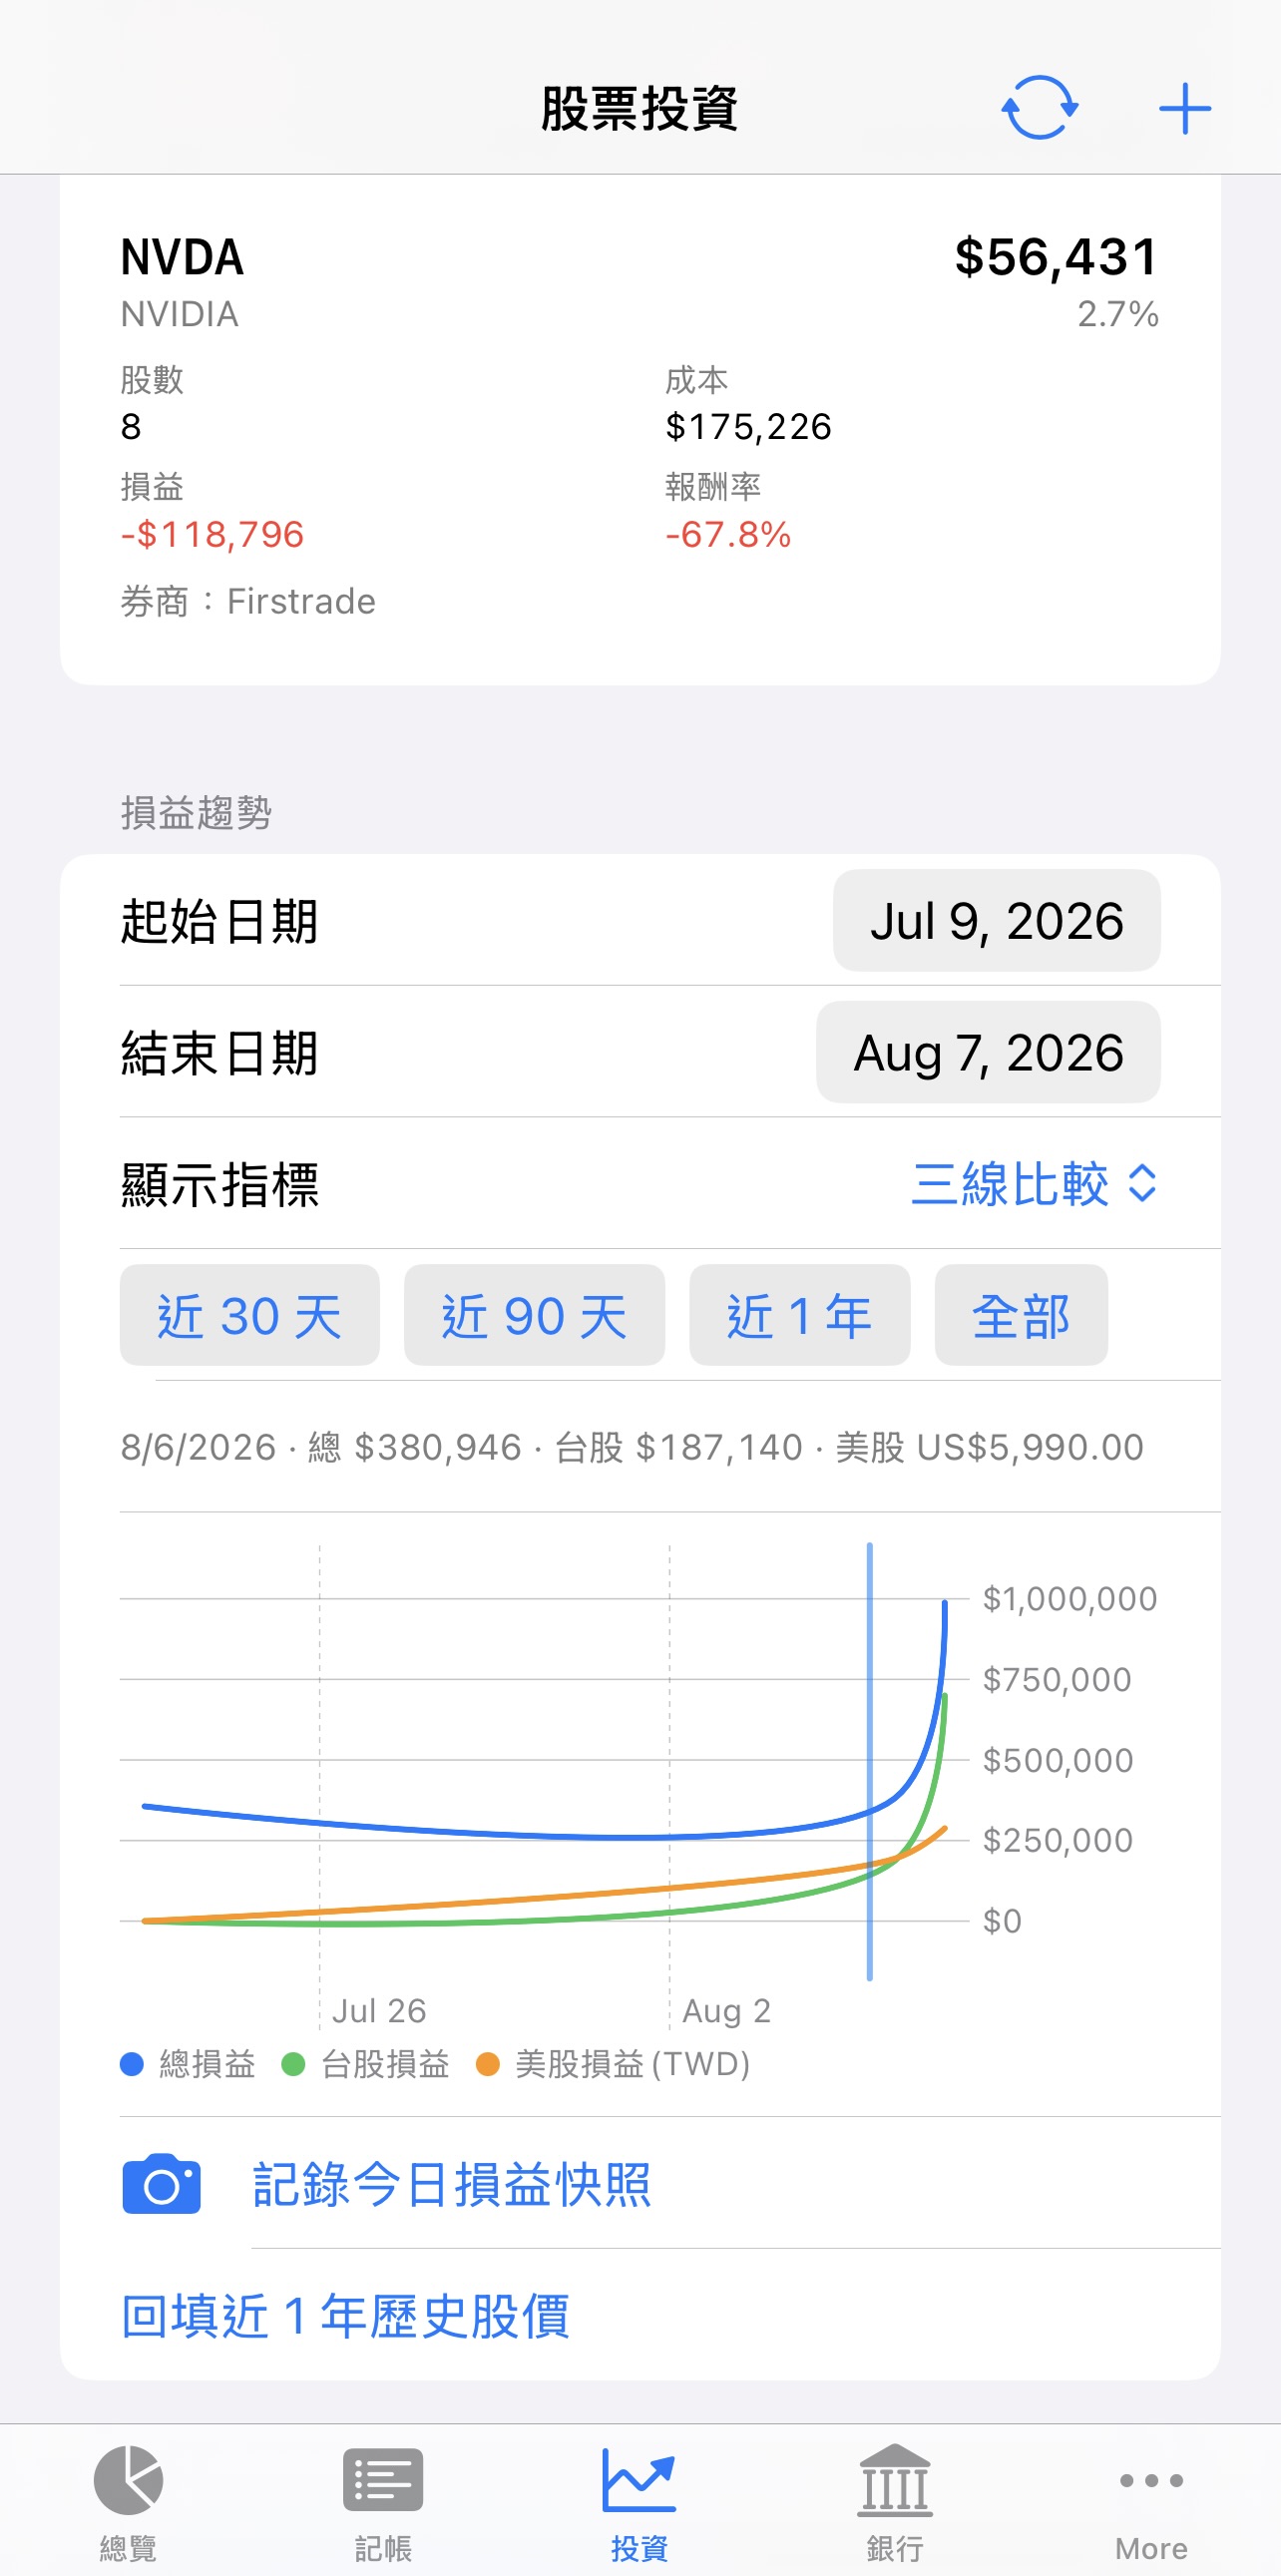
                                  P&L Trend — a 3-line comparison (total / Taiwan / US) over a selectable date range, with snapshot and historical price backfill actions
                                  Ticker allocation
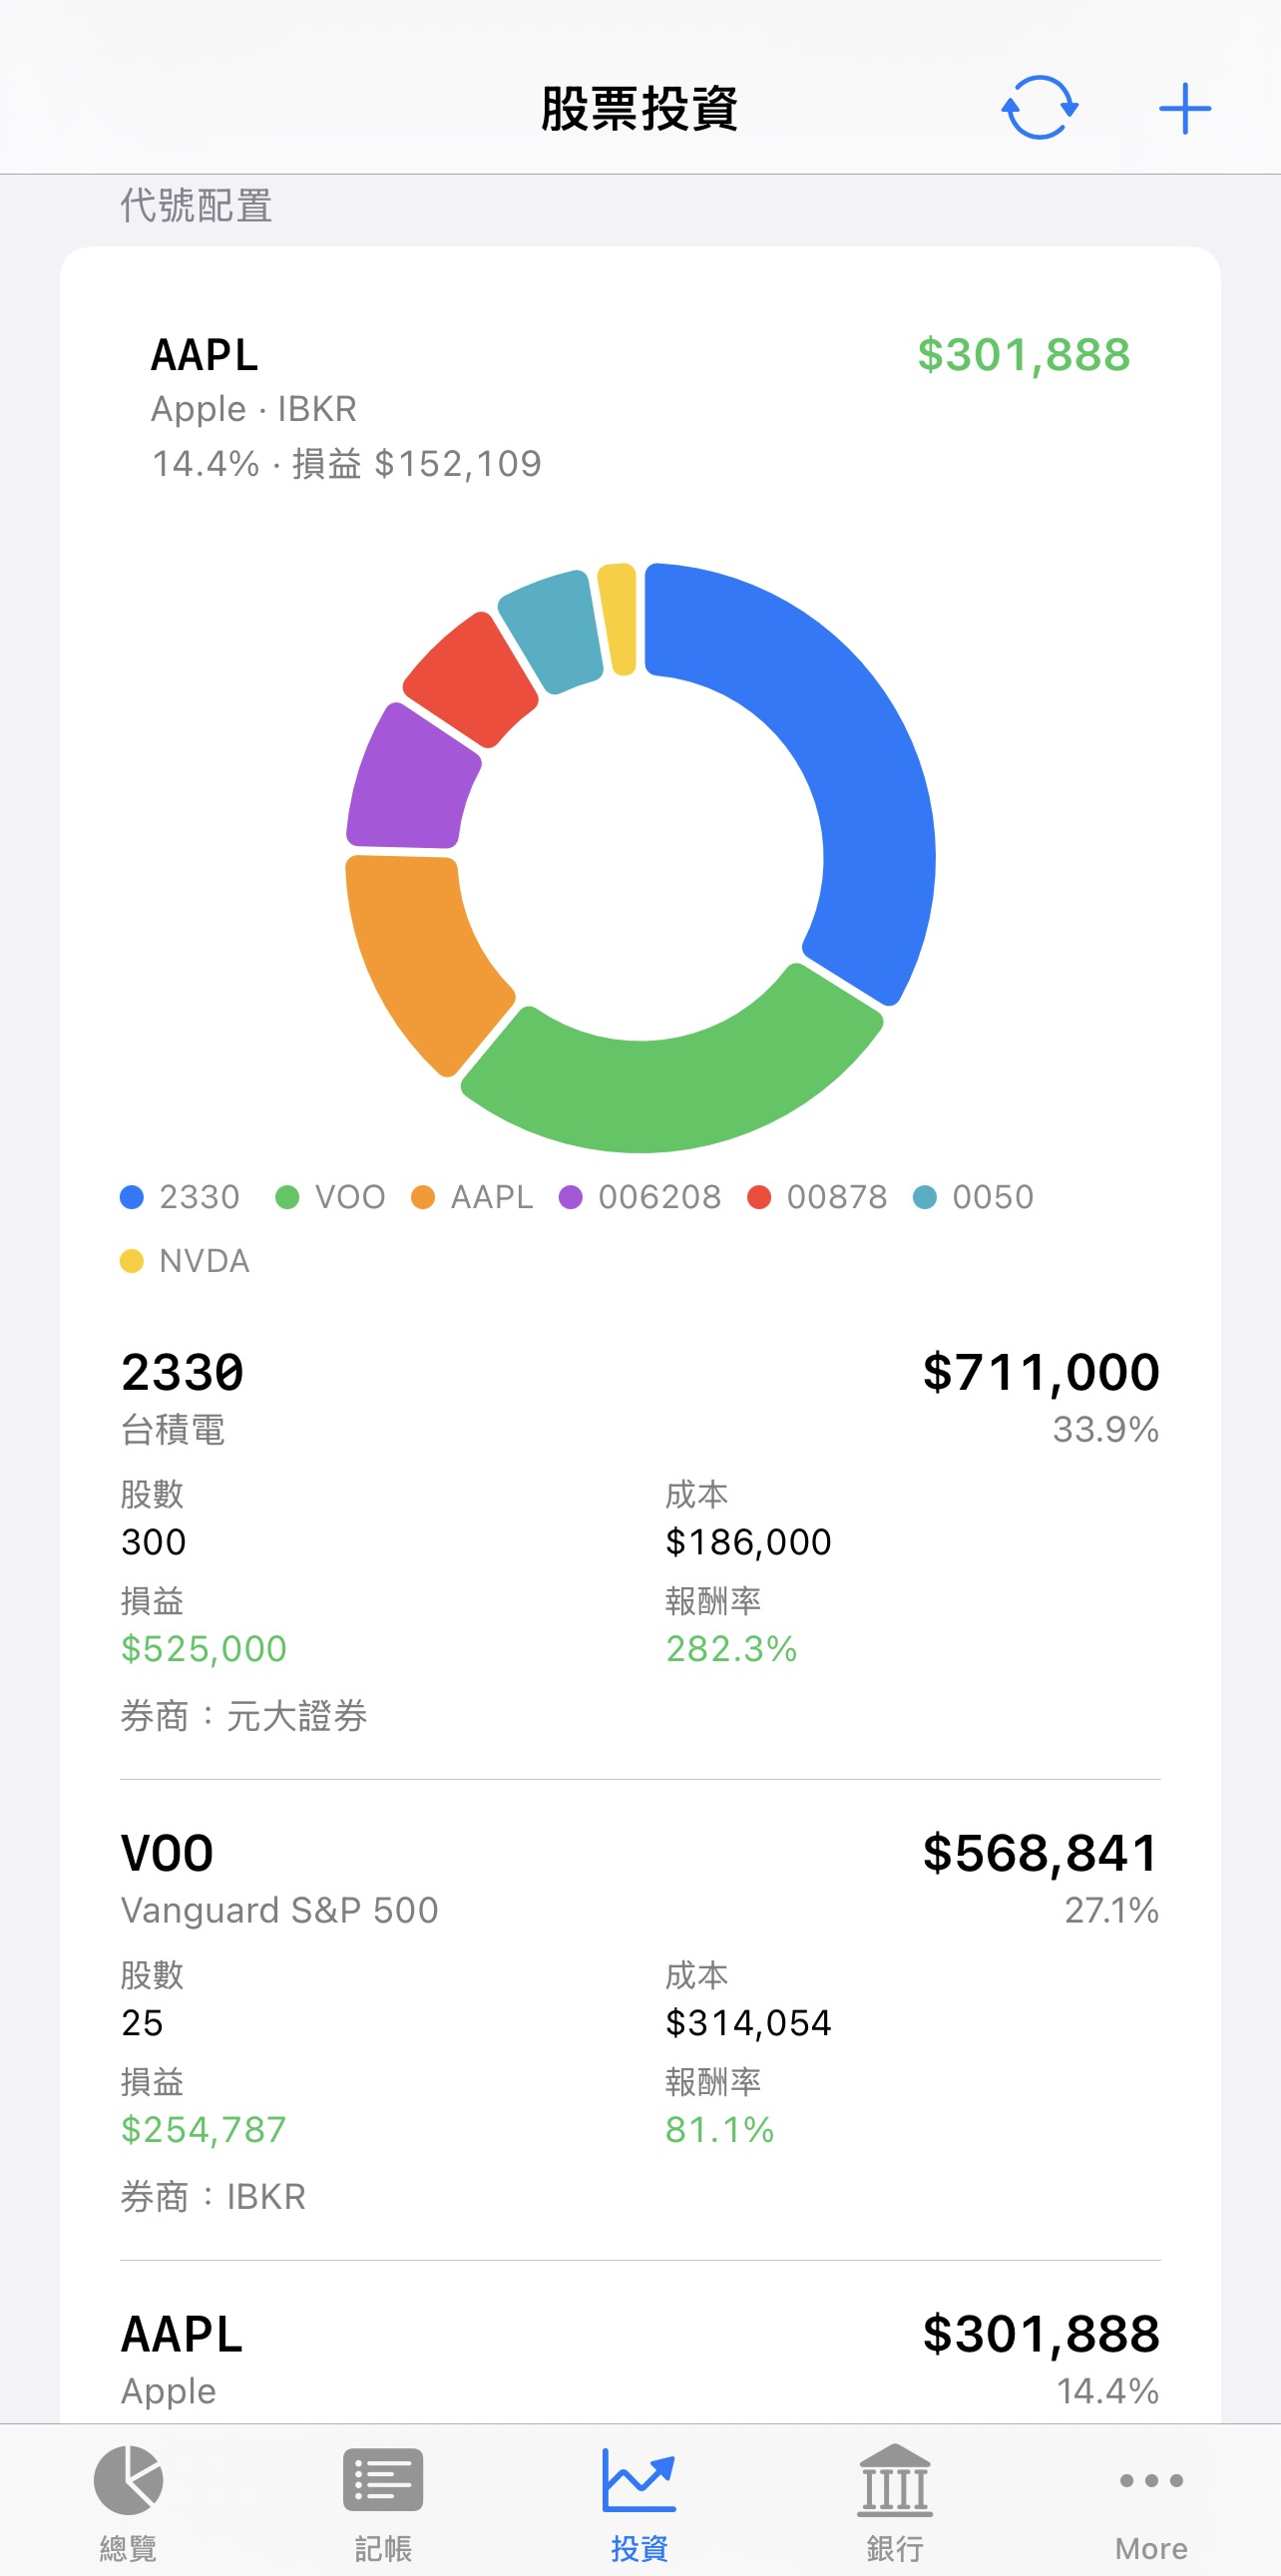
                                  Ticker Allocation — a combined donut chart across every ticker; tap a slice for that ticker's value, weight and P&L
                                  Banking & Loans
                                  Account distribution
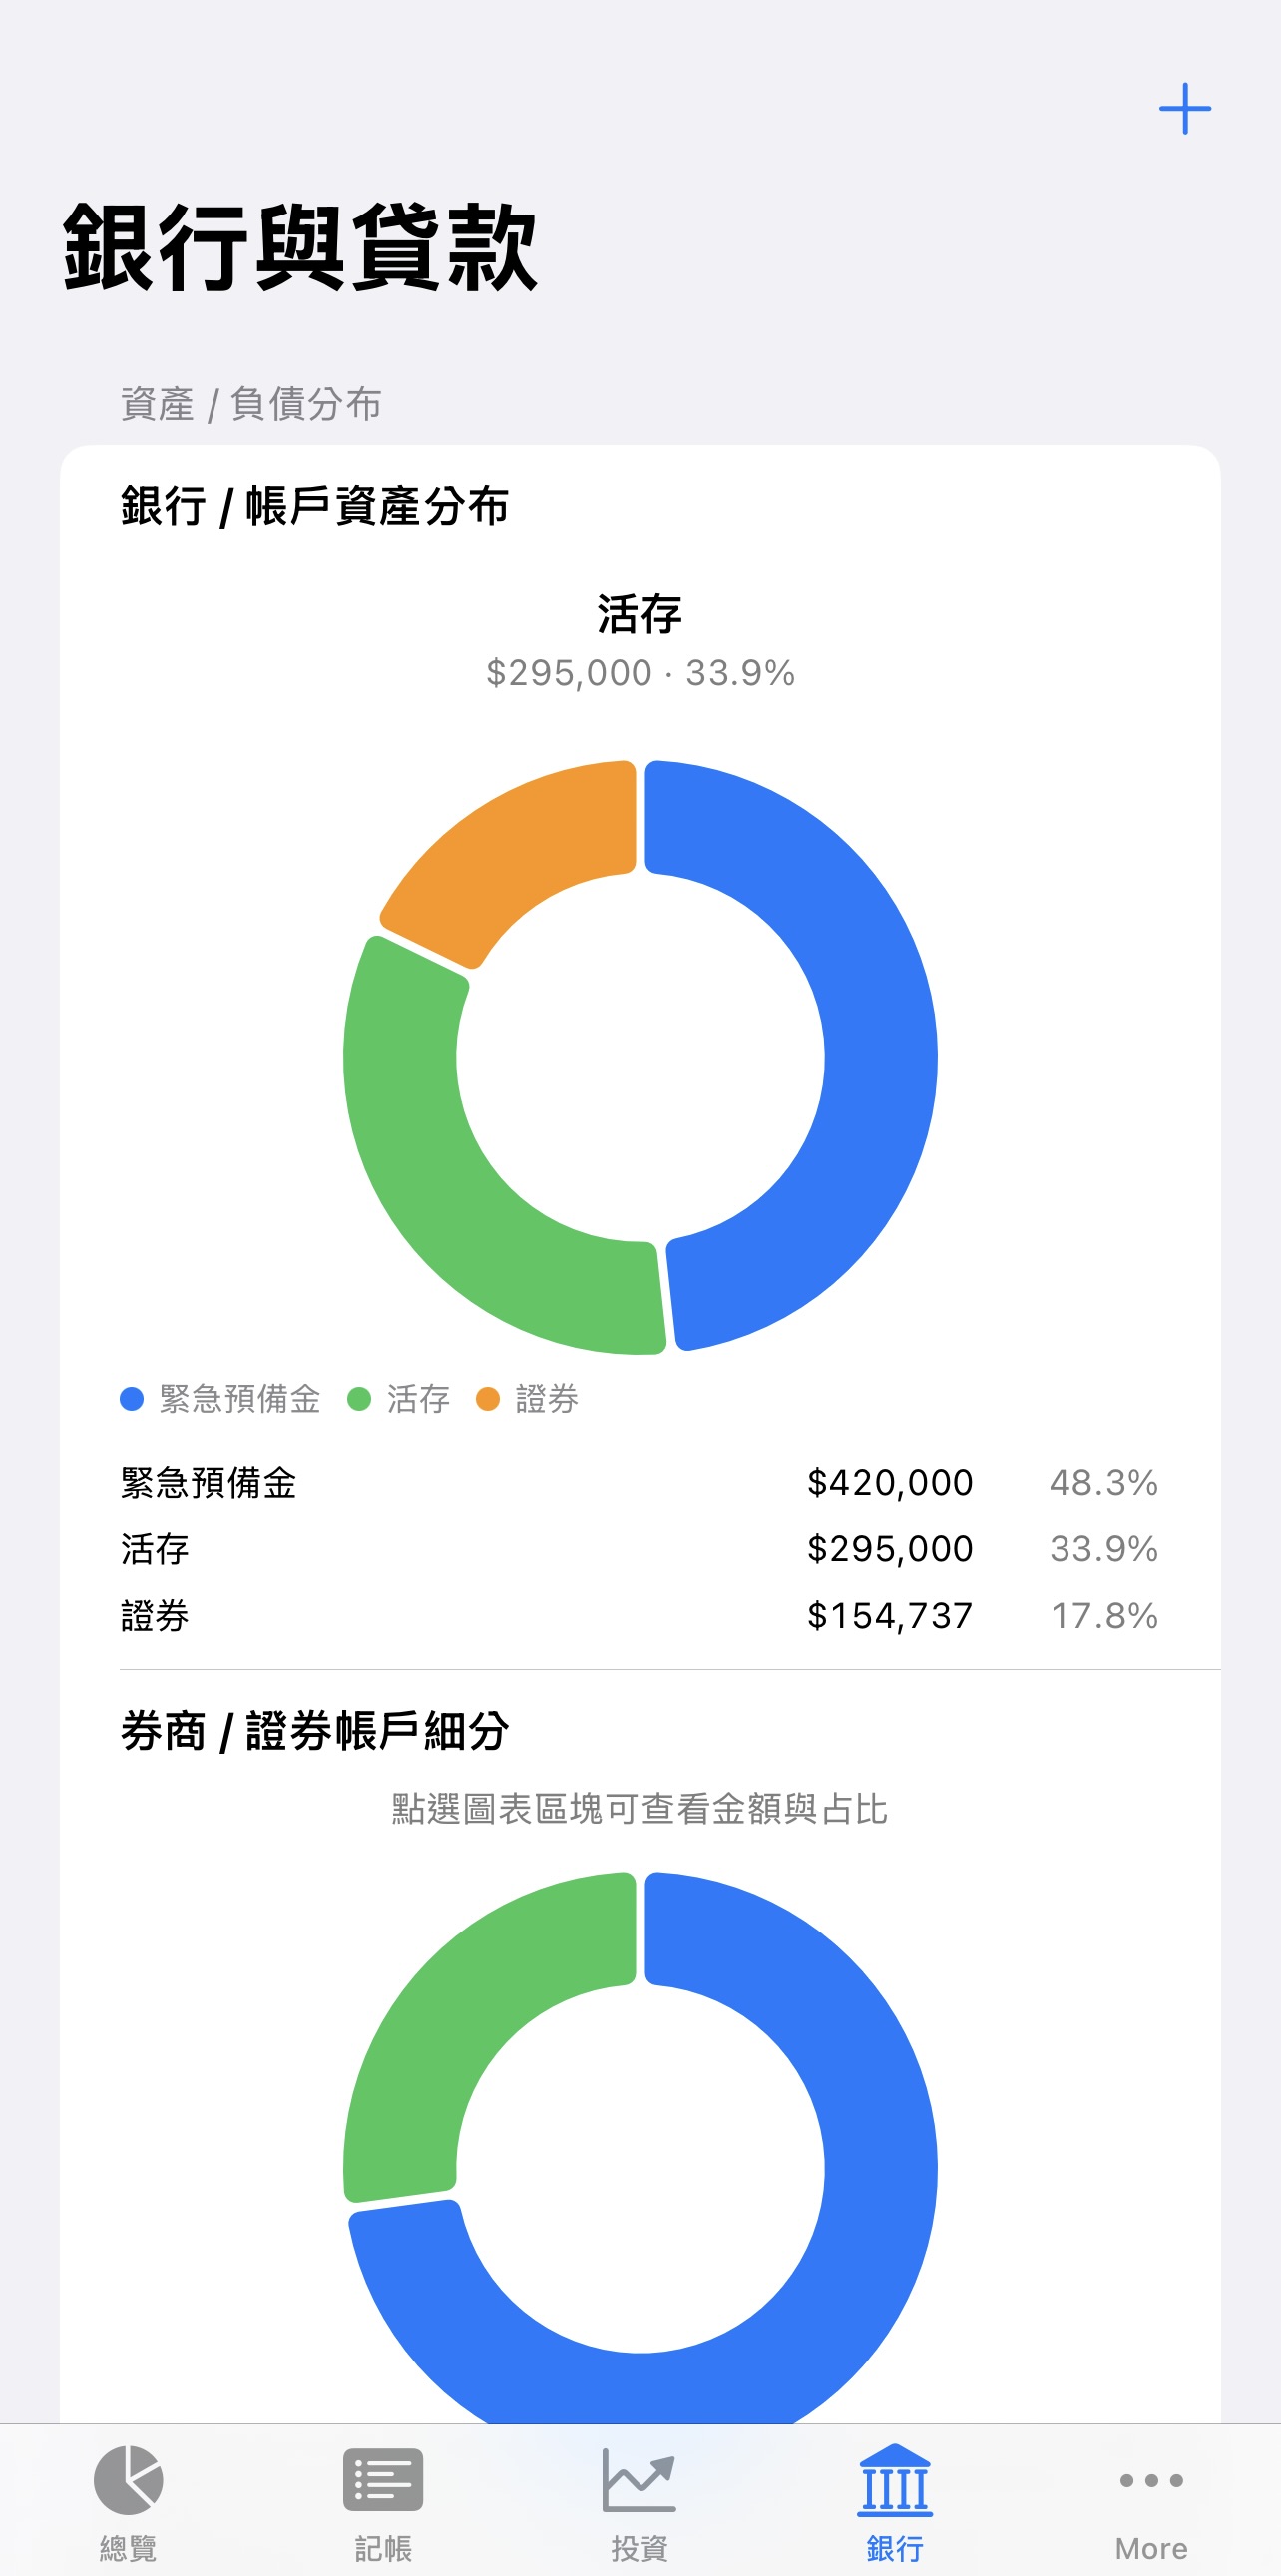
                                  Account Distribution — a donut chart split across checking, emergency fund and brokerage accounts
                                  Brokerage breakdown and loan distribution
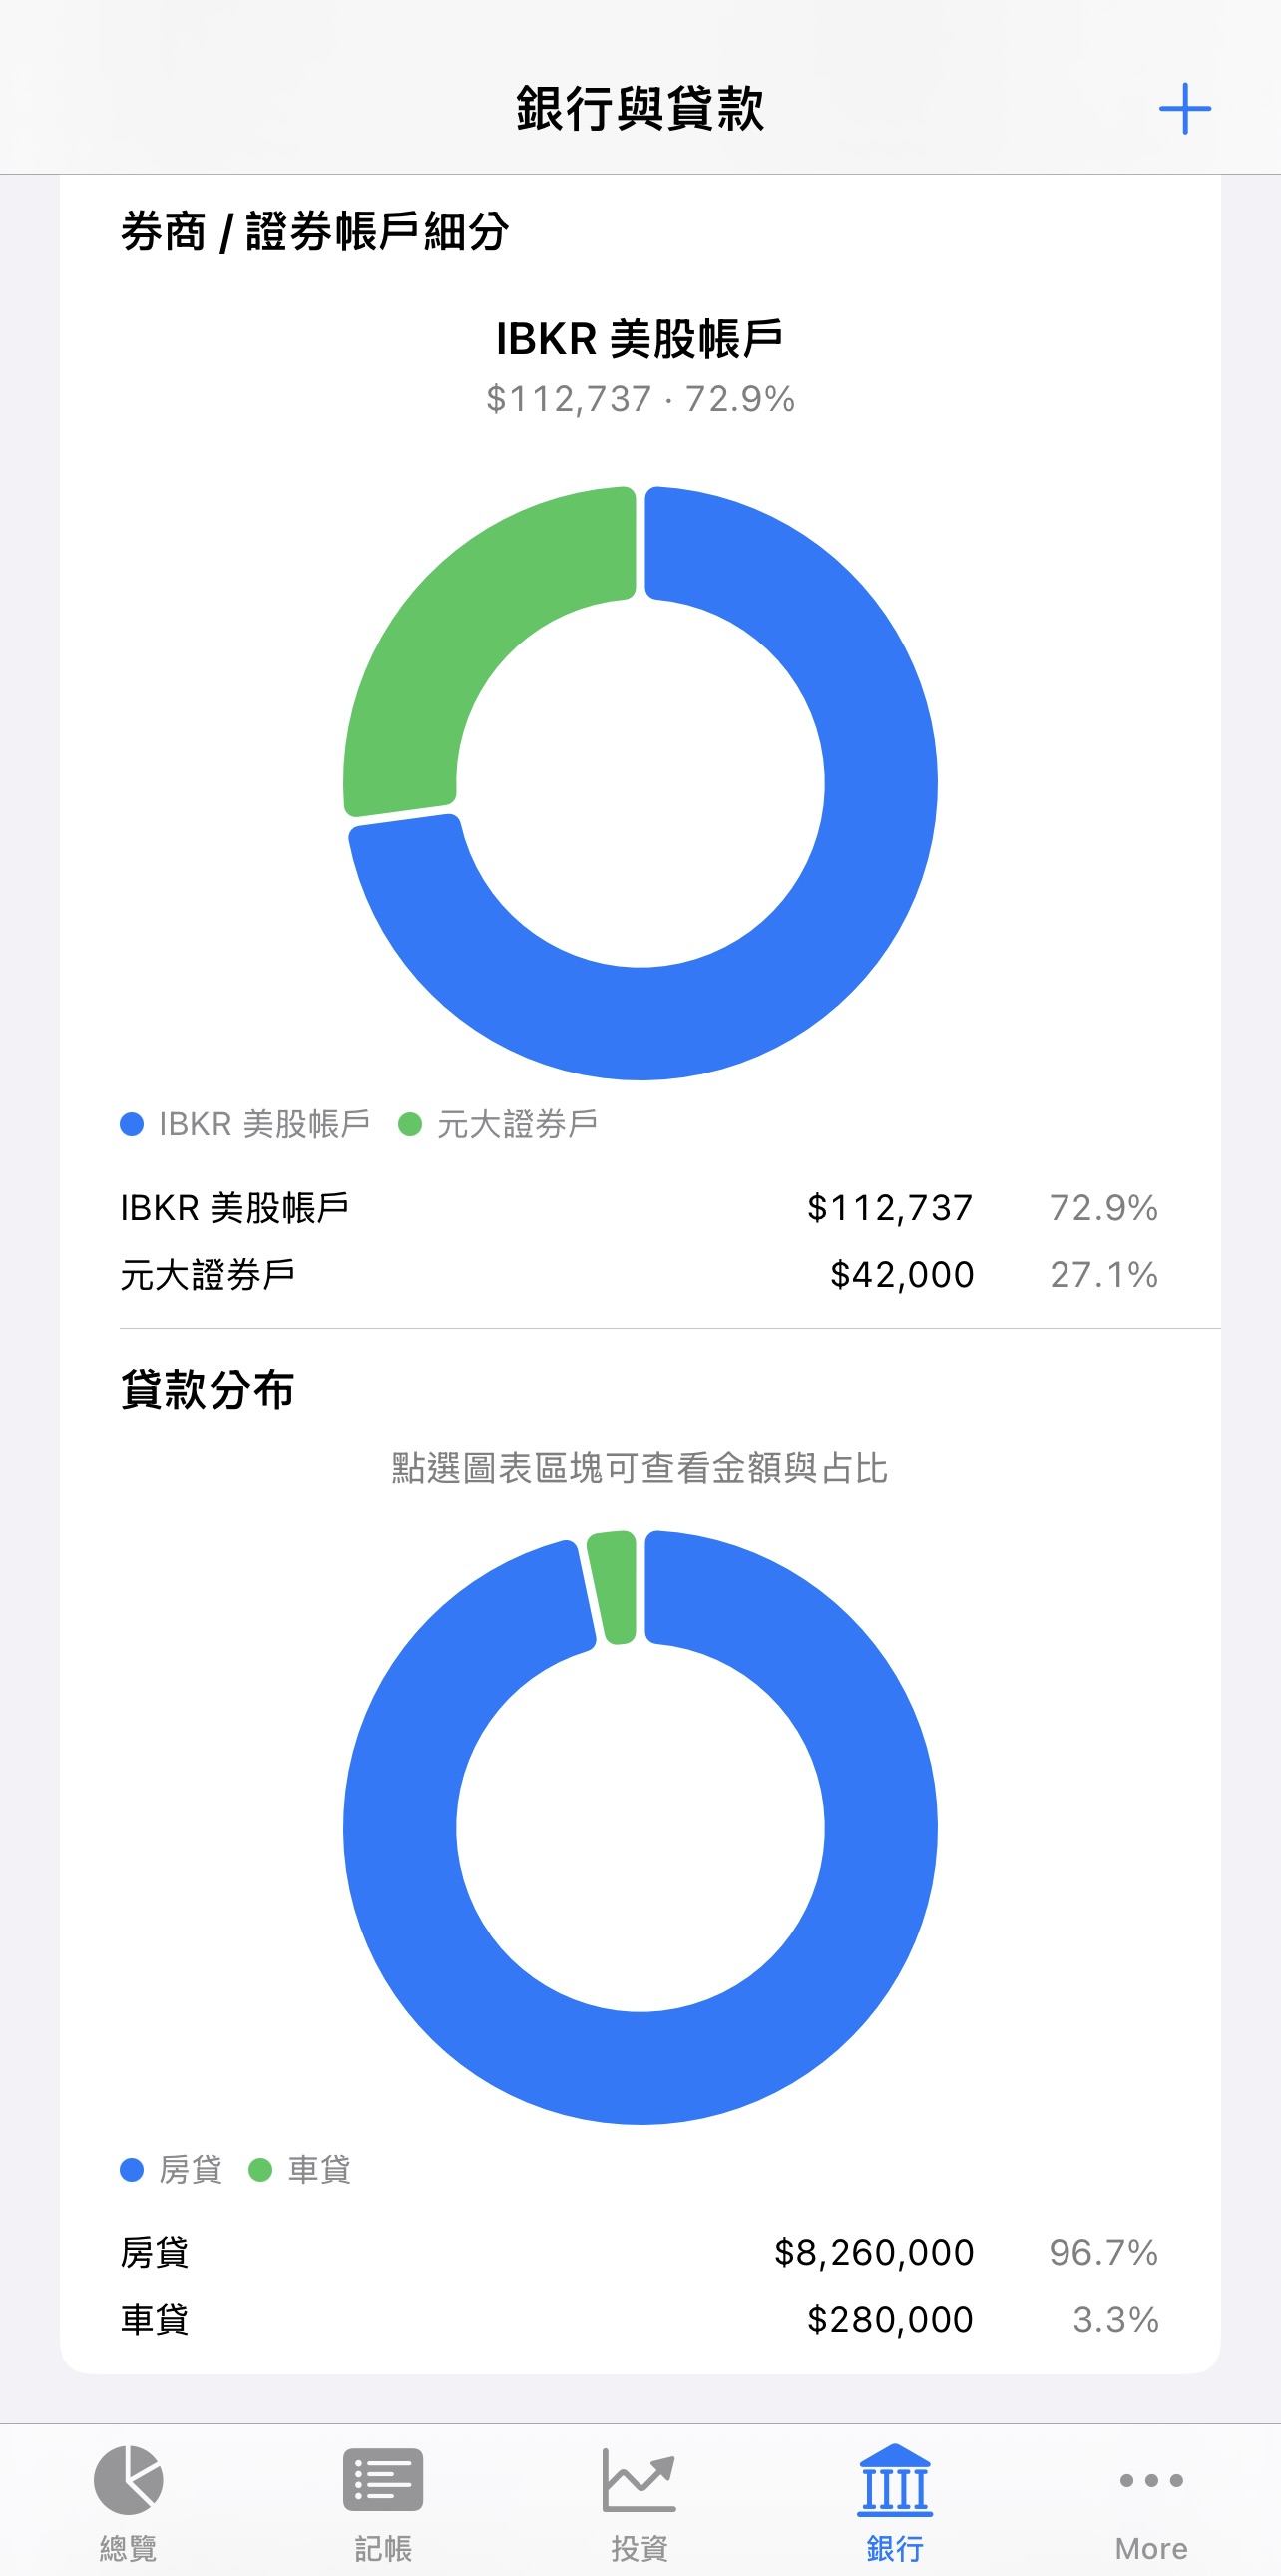
                                  Brokerage Breakdown & Loan Distribution — per-brokerage account split, plus a mortgage/auto-loan distribution chart
                                  Accounts and repayment progress
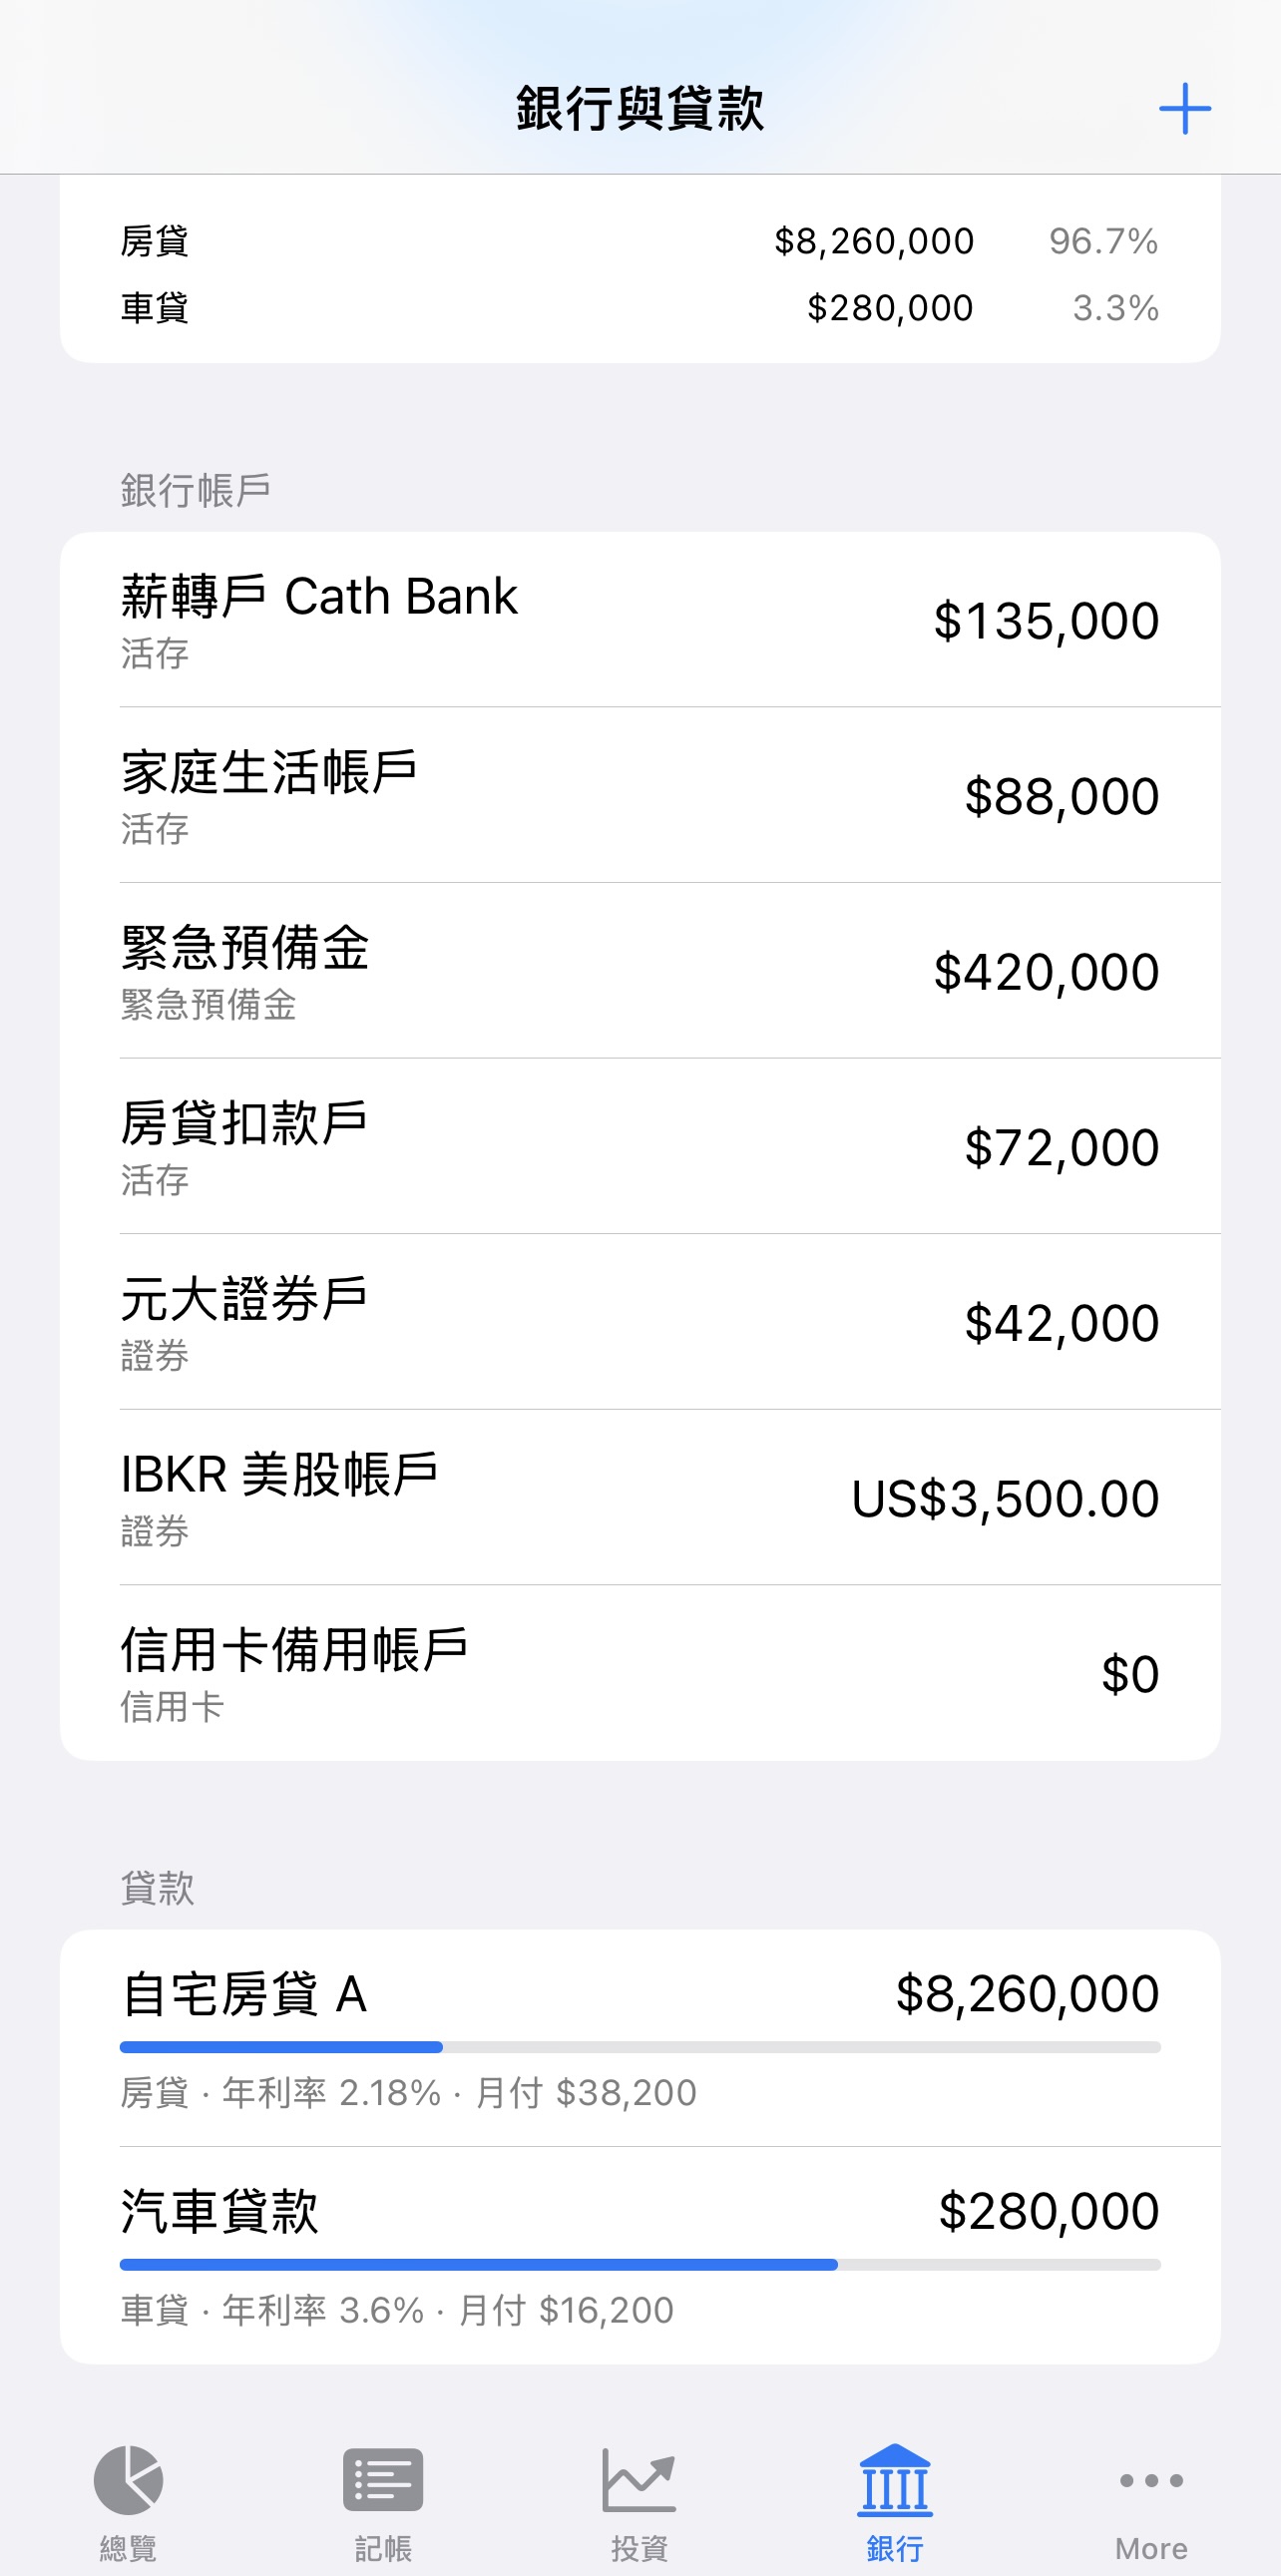
                                  Accounts & Repayment Progress — every bank/brokerage account balance, plus each loan's remaining principal, interest rate, monthly payment and progress bar
                                  Insurance Policies
                                  Insurance overview
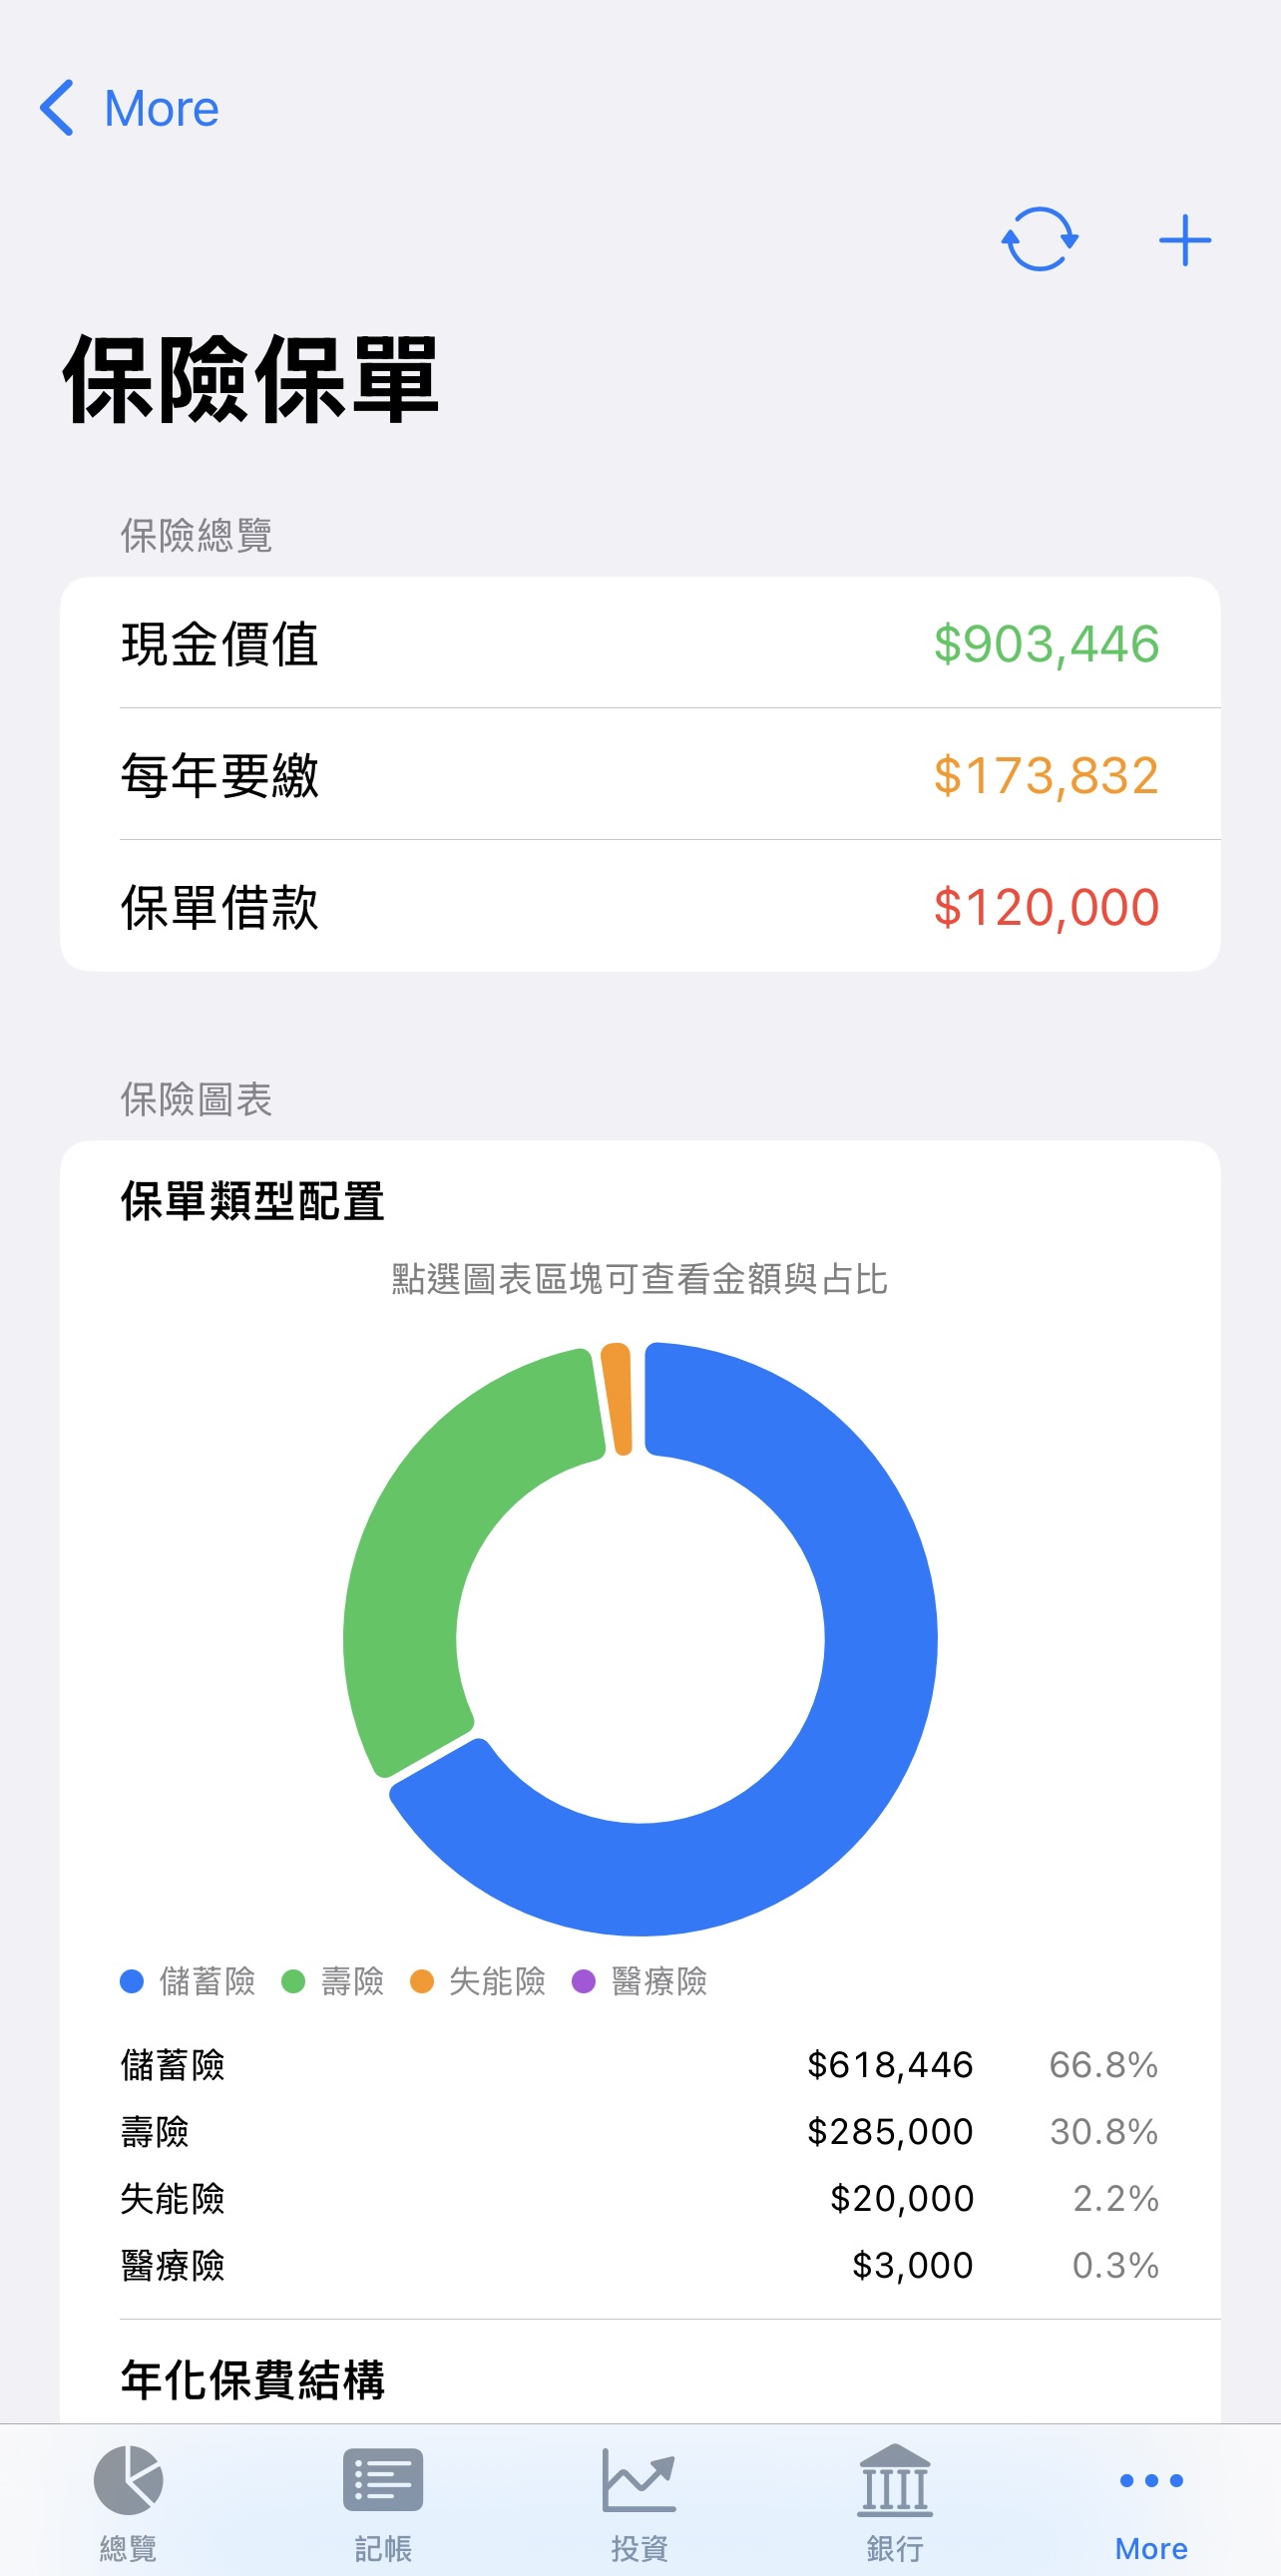
                                  Insurance Overview — cash value, annual premium due and policy loans, plus a policy-type allocation chart (savings / life / disability / medical)
                                  Premium purpose and policy list
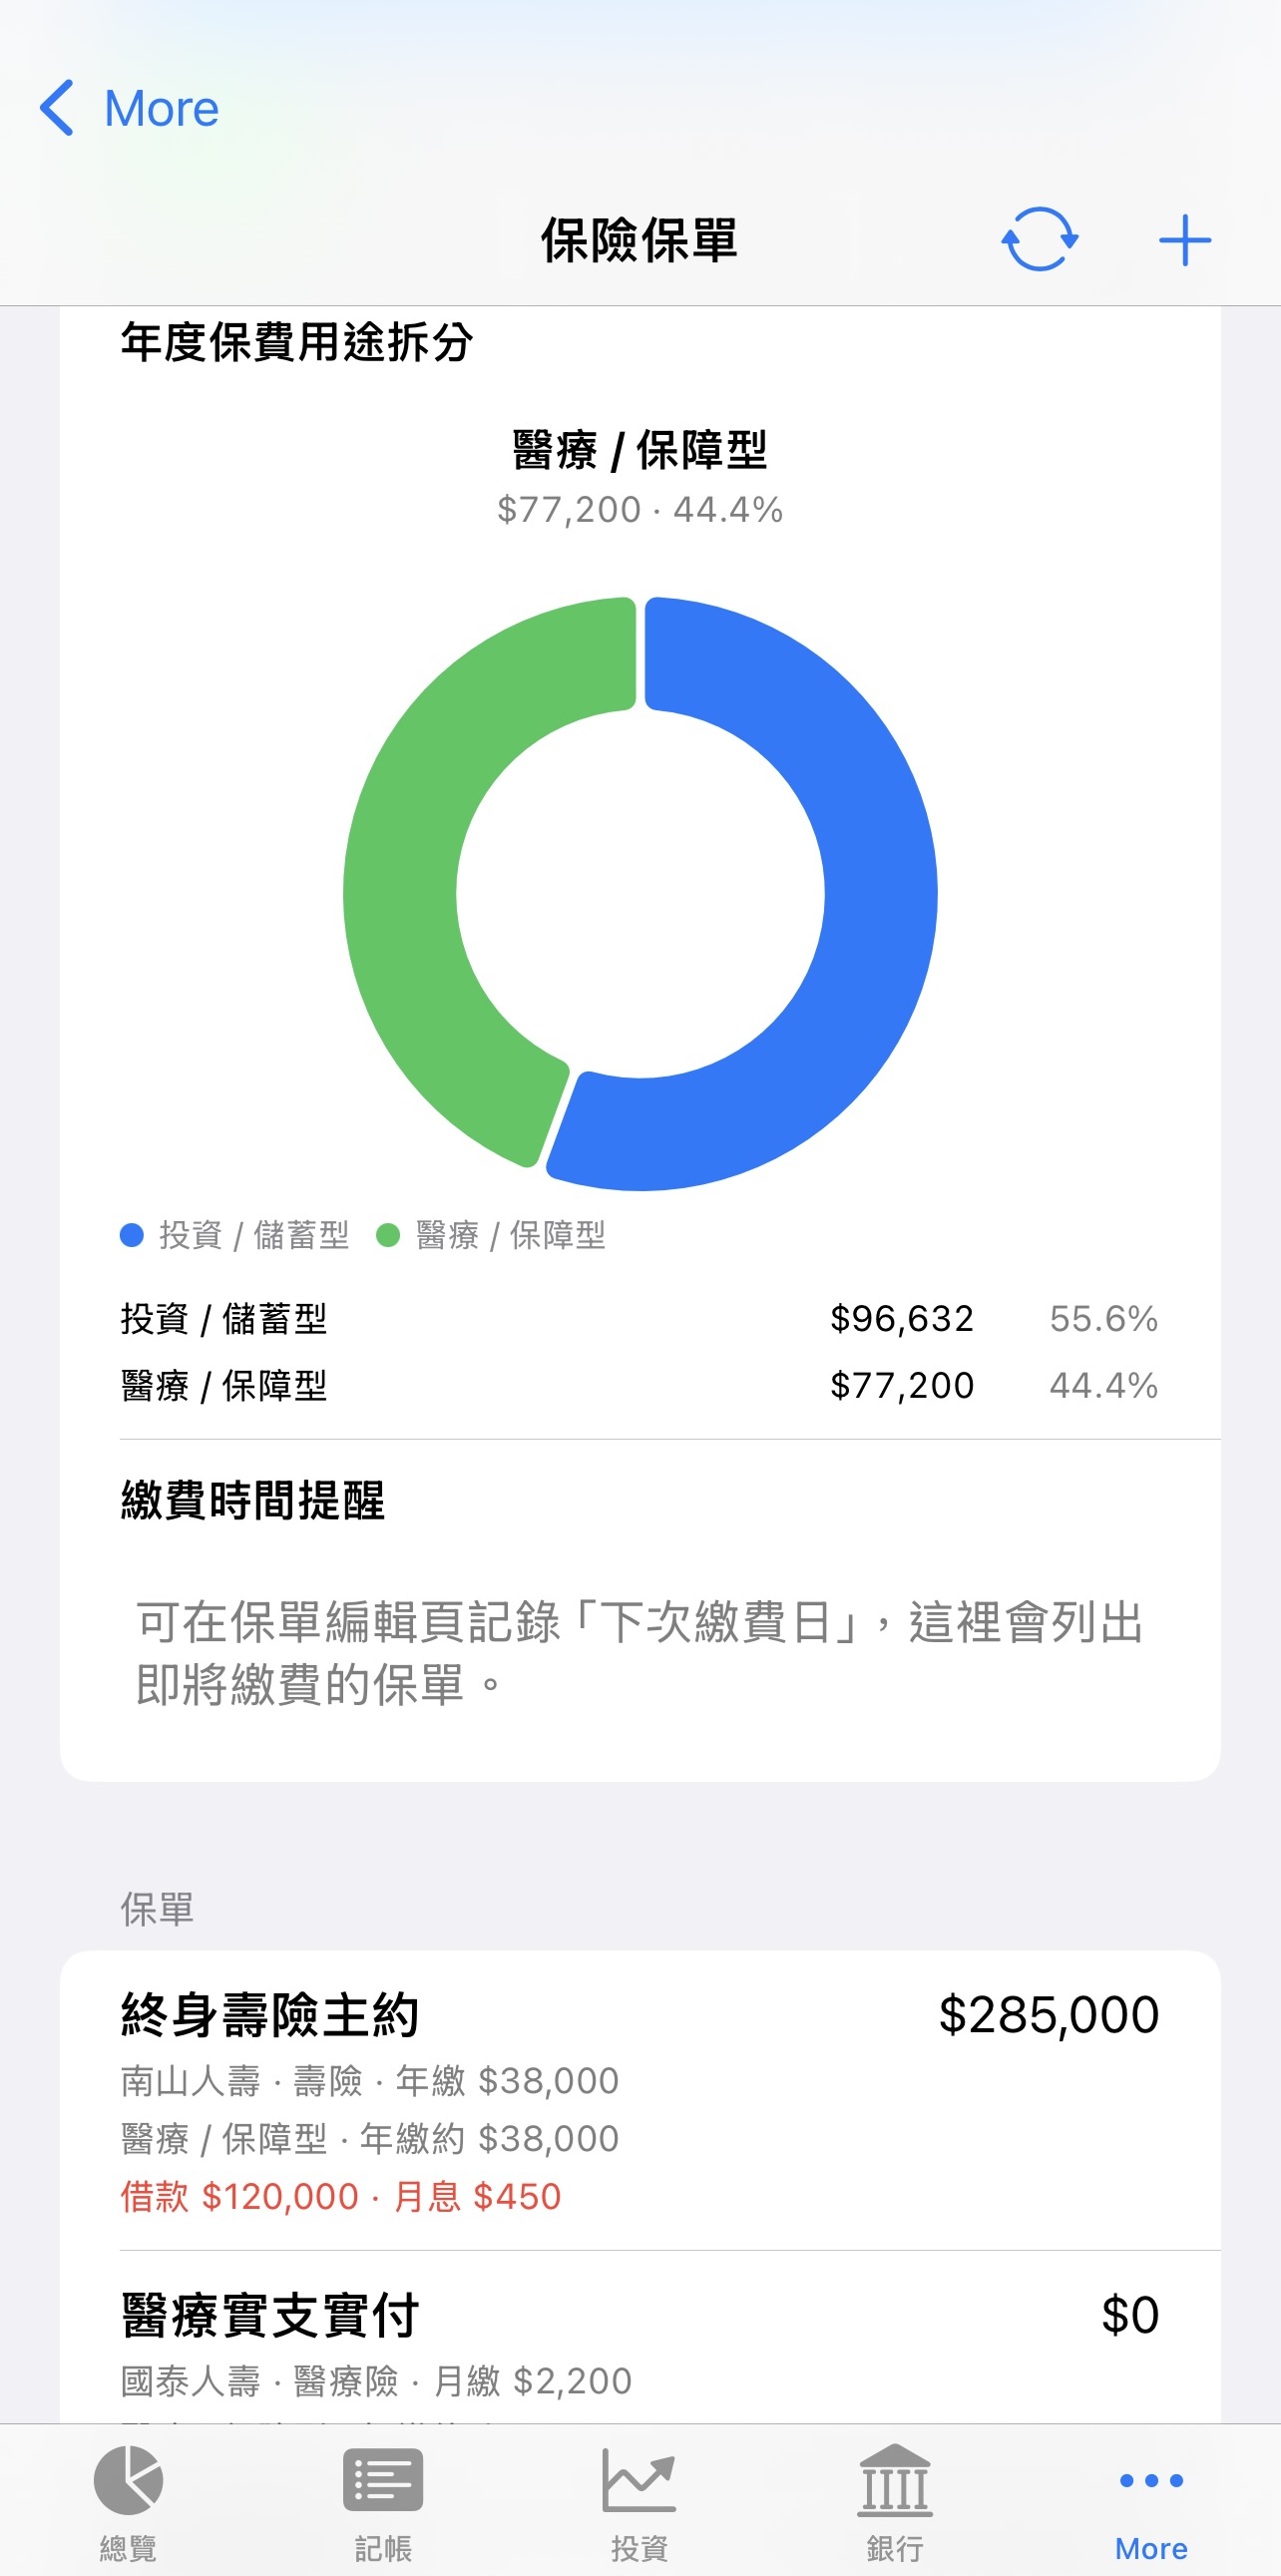
                                  Premium Purpose & Policy List — splits annual premiums into investment/savings-type vs. medical/protection-type, with a policy list showing loans and payment reminders
                                  Real Estate
                                  Real estate overview
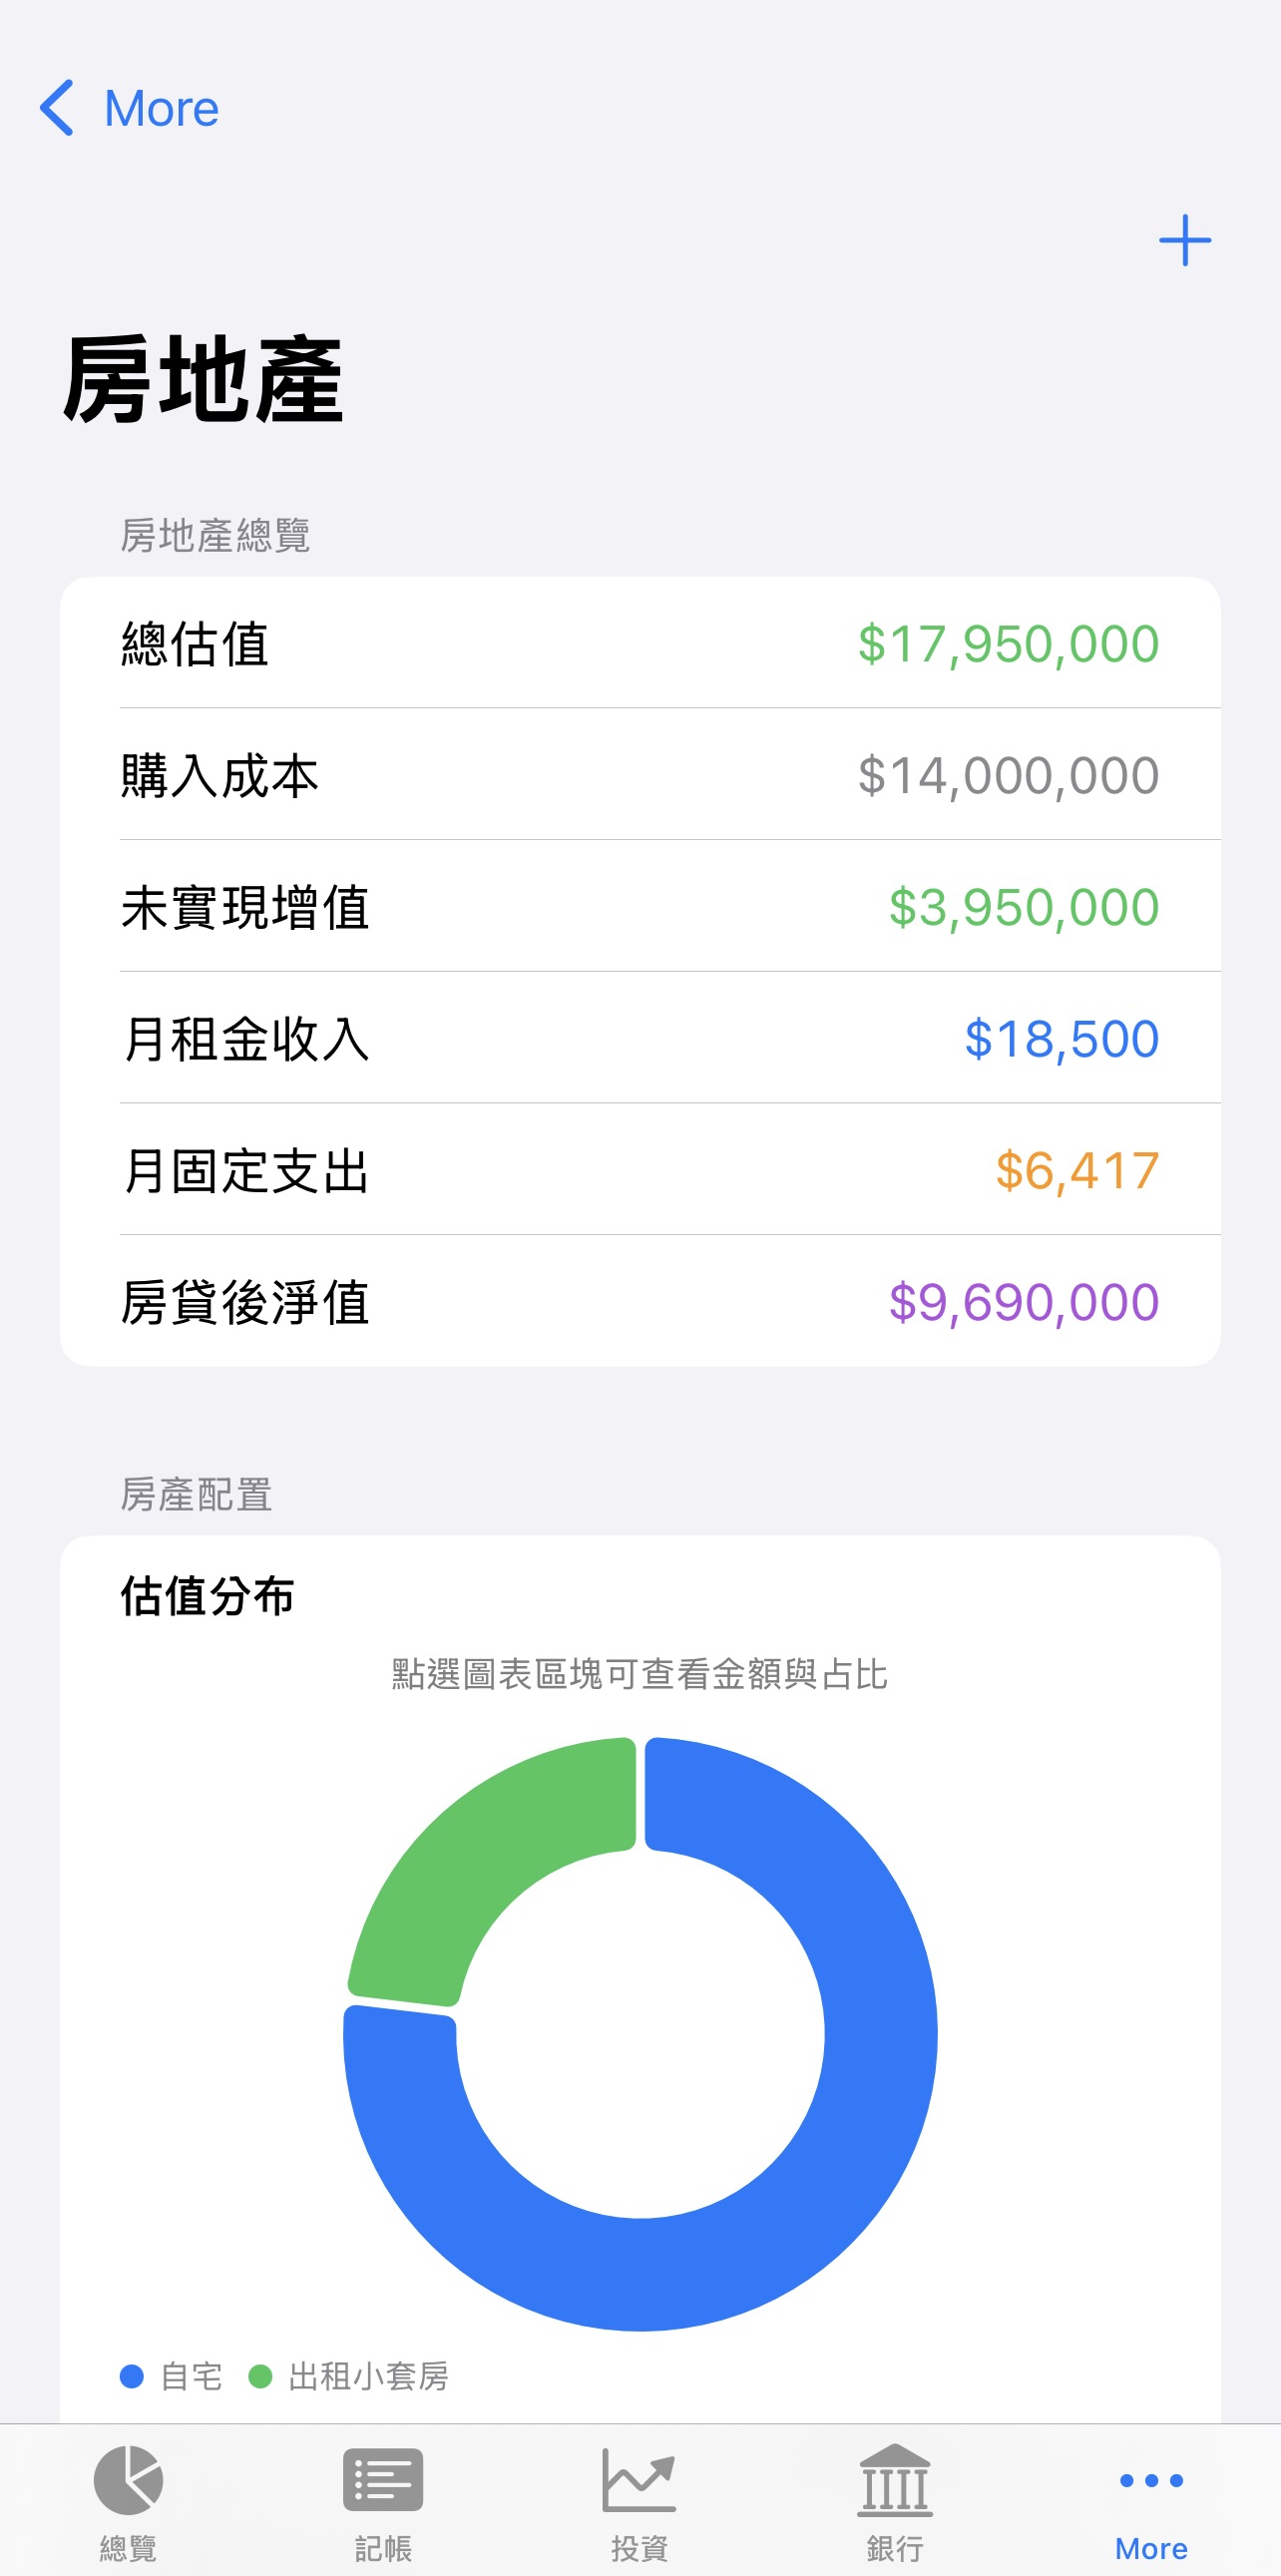
                                  Real Estate Overview — total valuation, purchase cost, unrealized appreciation, monthly rent, fixed costs, and net value after the mortgage
                                  Property allocation and rent vs costs
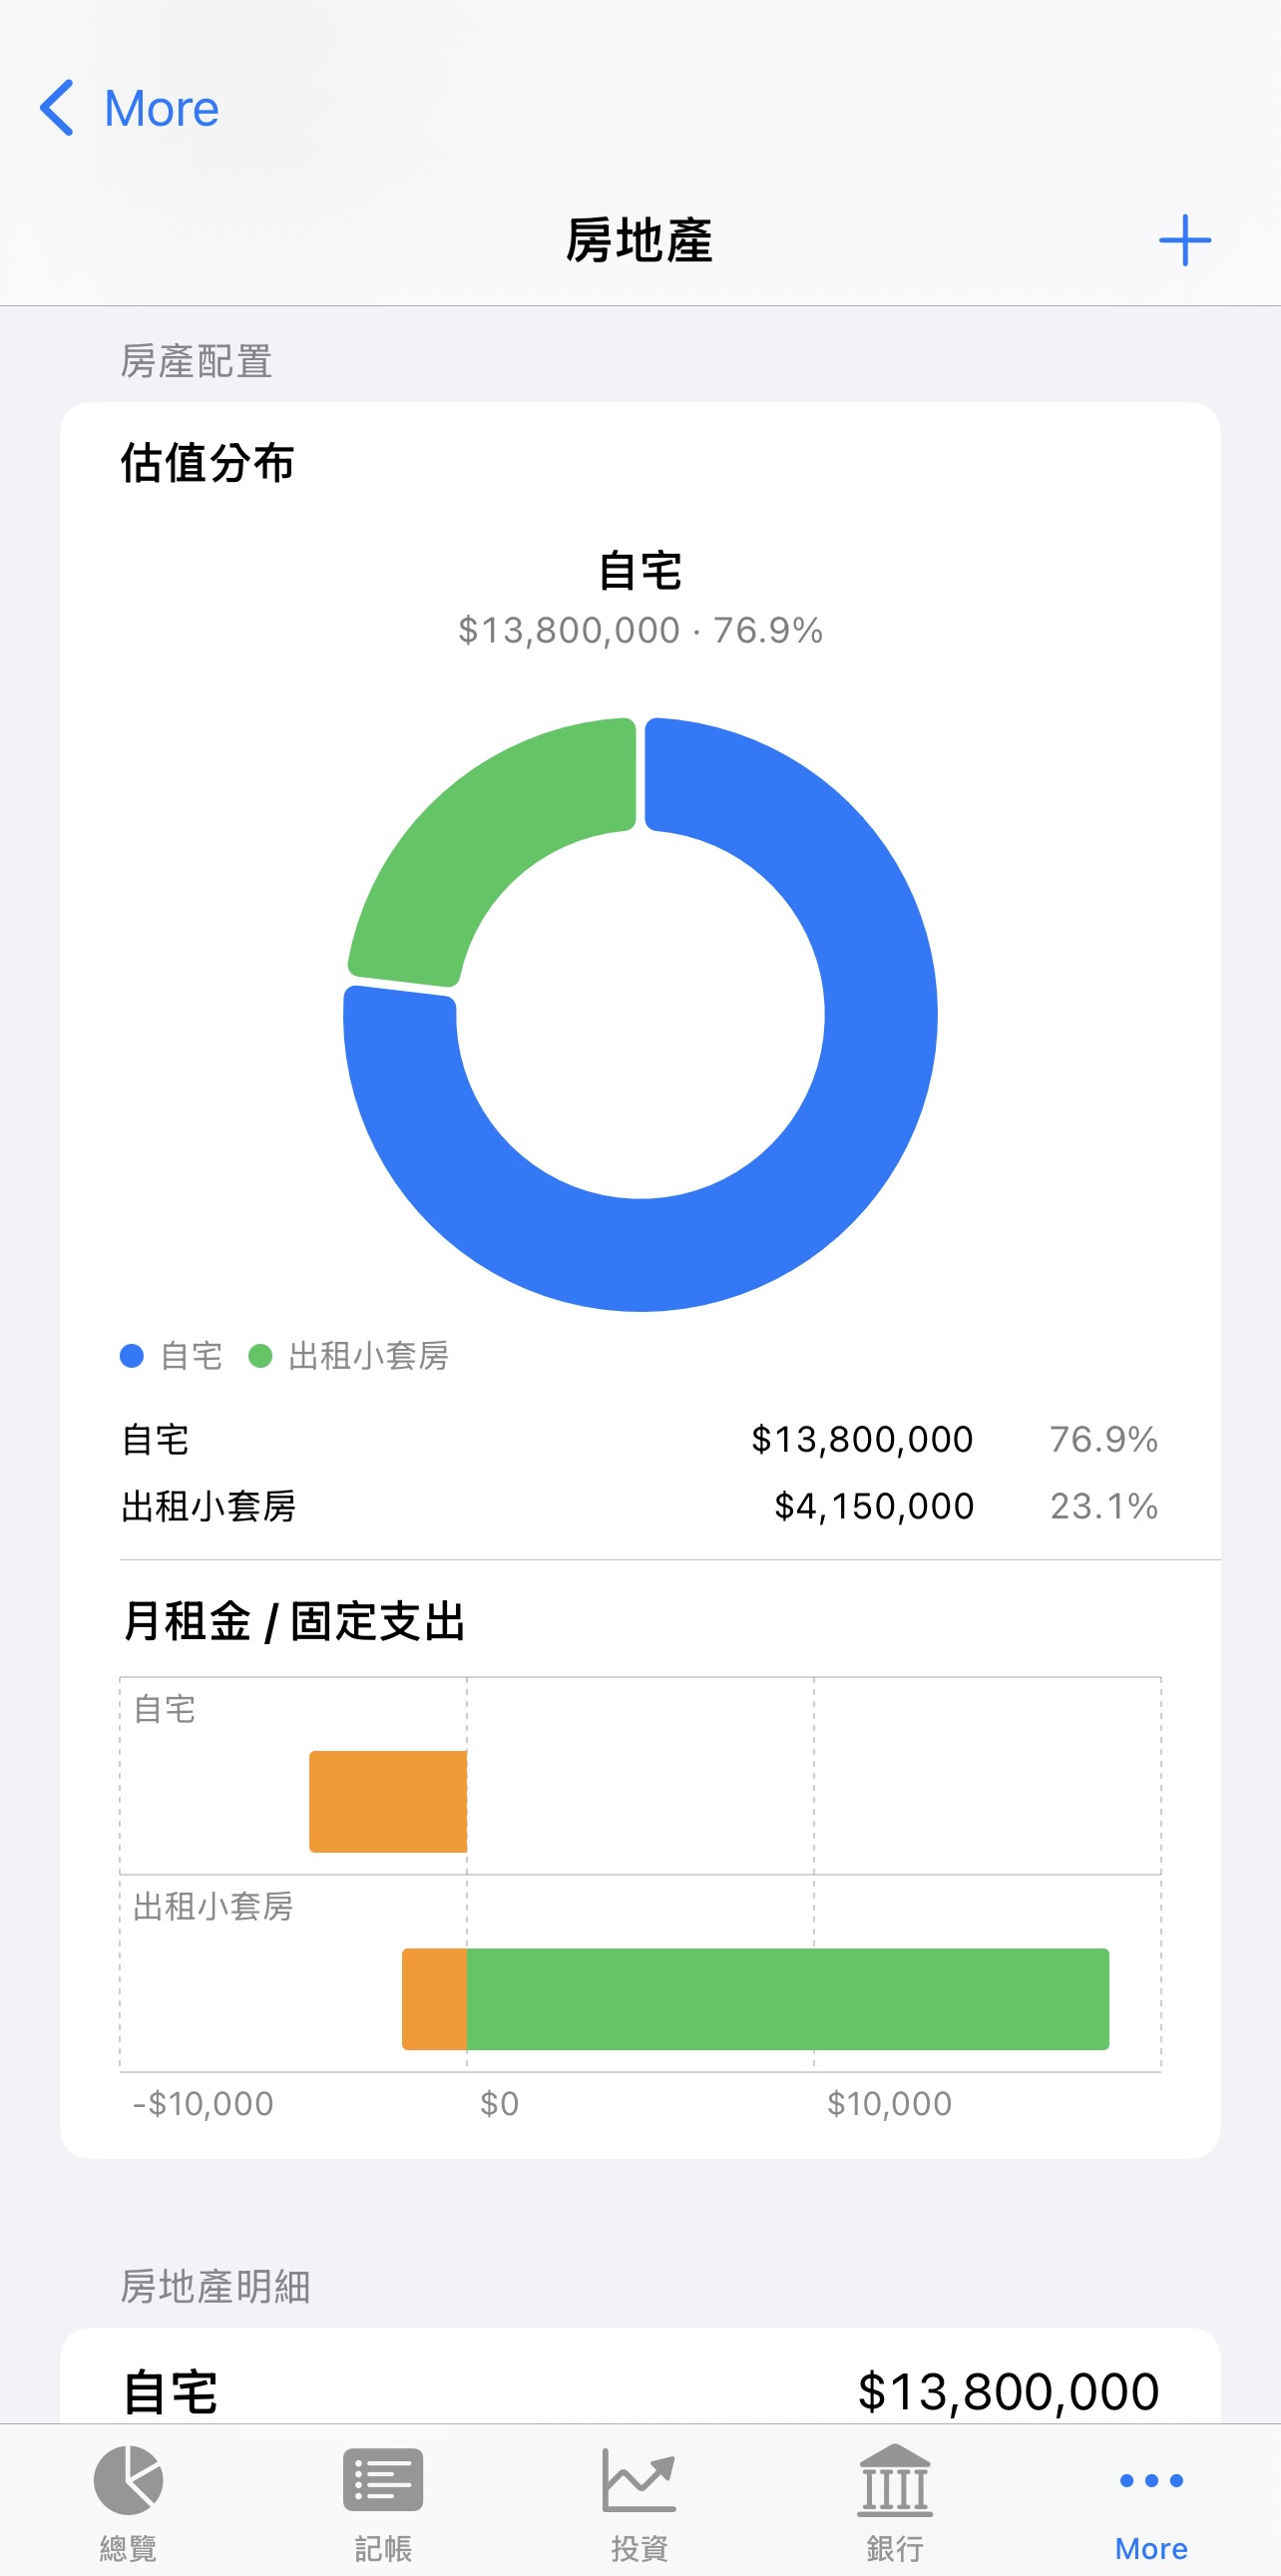
                                  Property Allocation & Rent vs. Costs — per-property valuation share, plus a rent-vs-fixed-cost comparison chart
                                  Financial Planning
                                  Goals and budgets
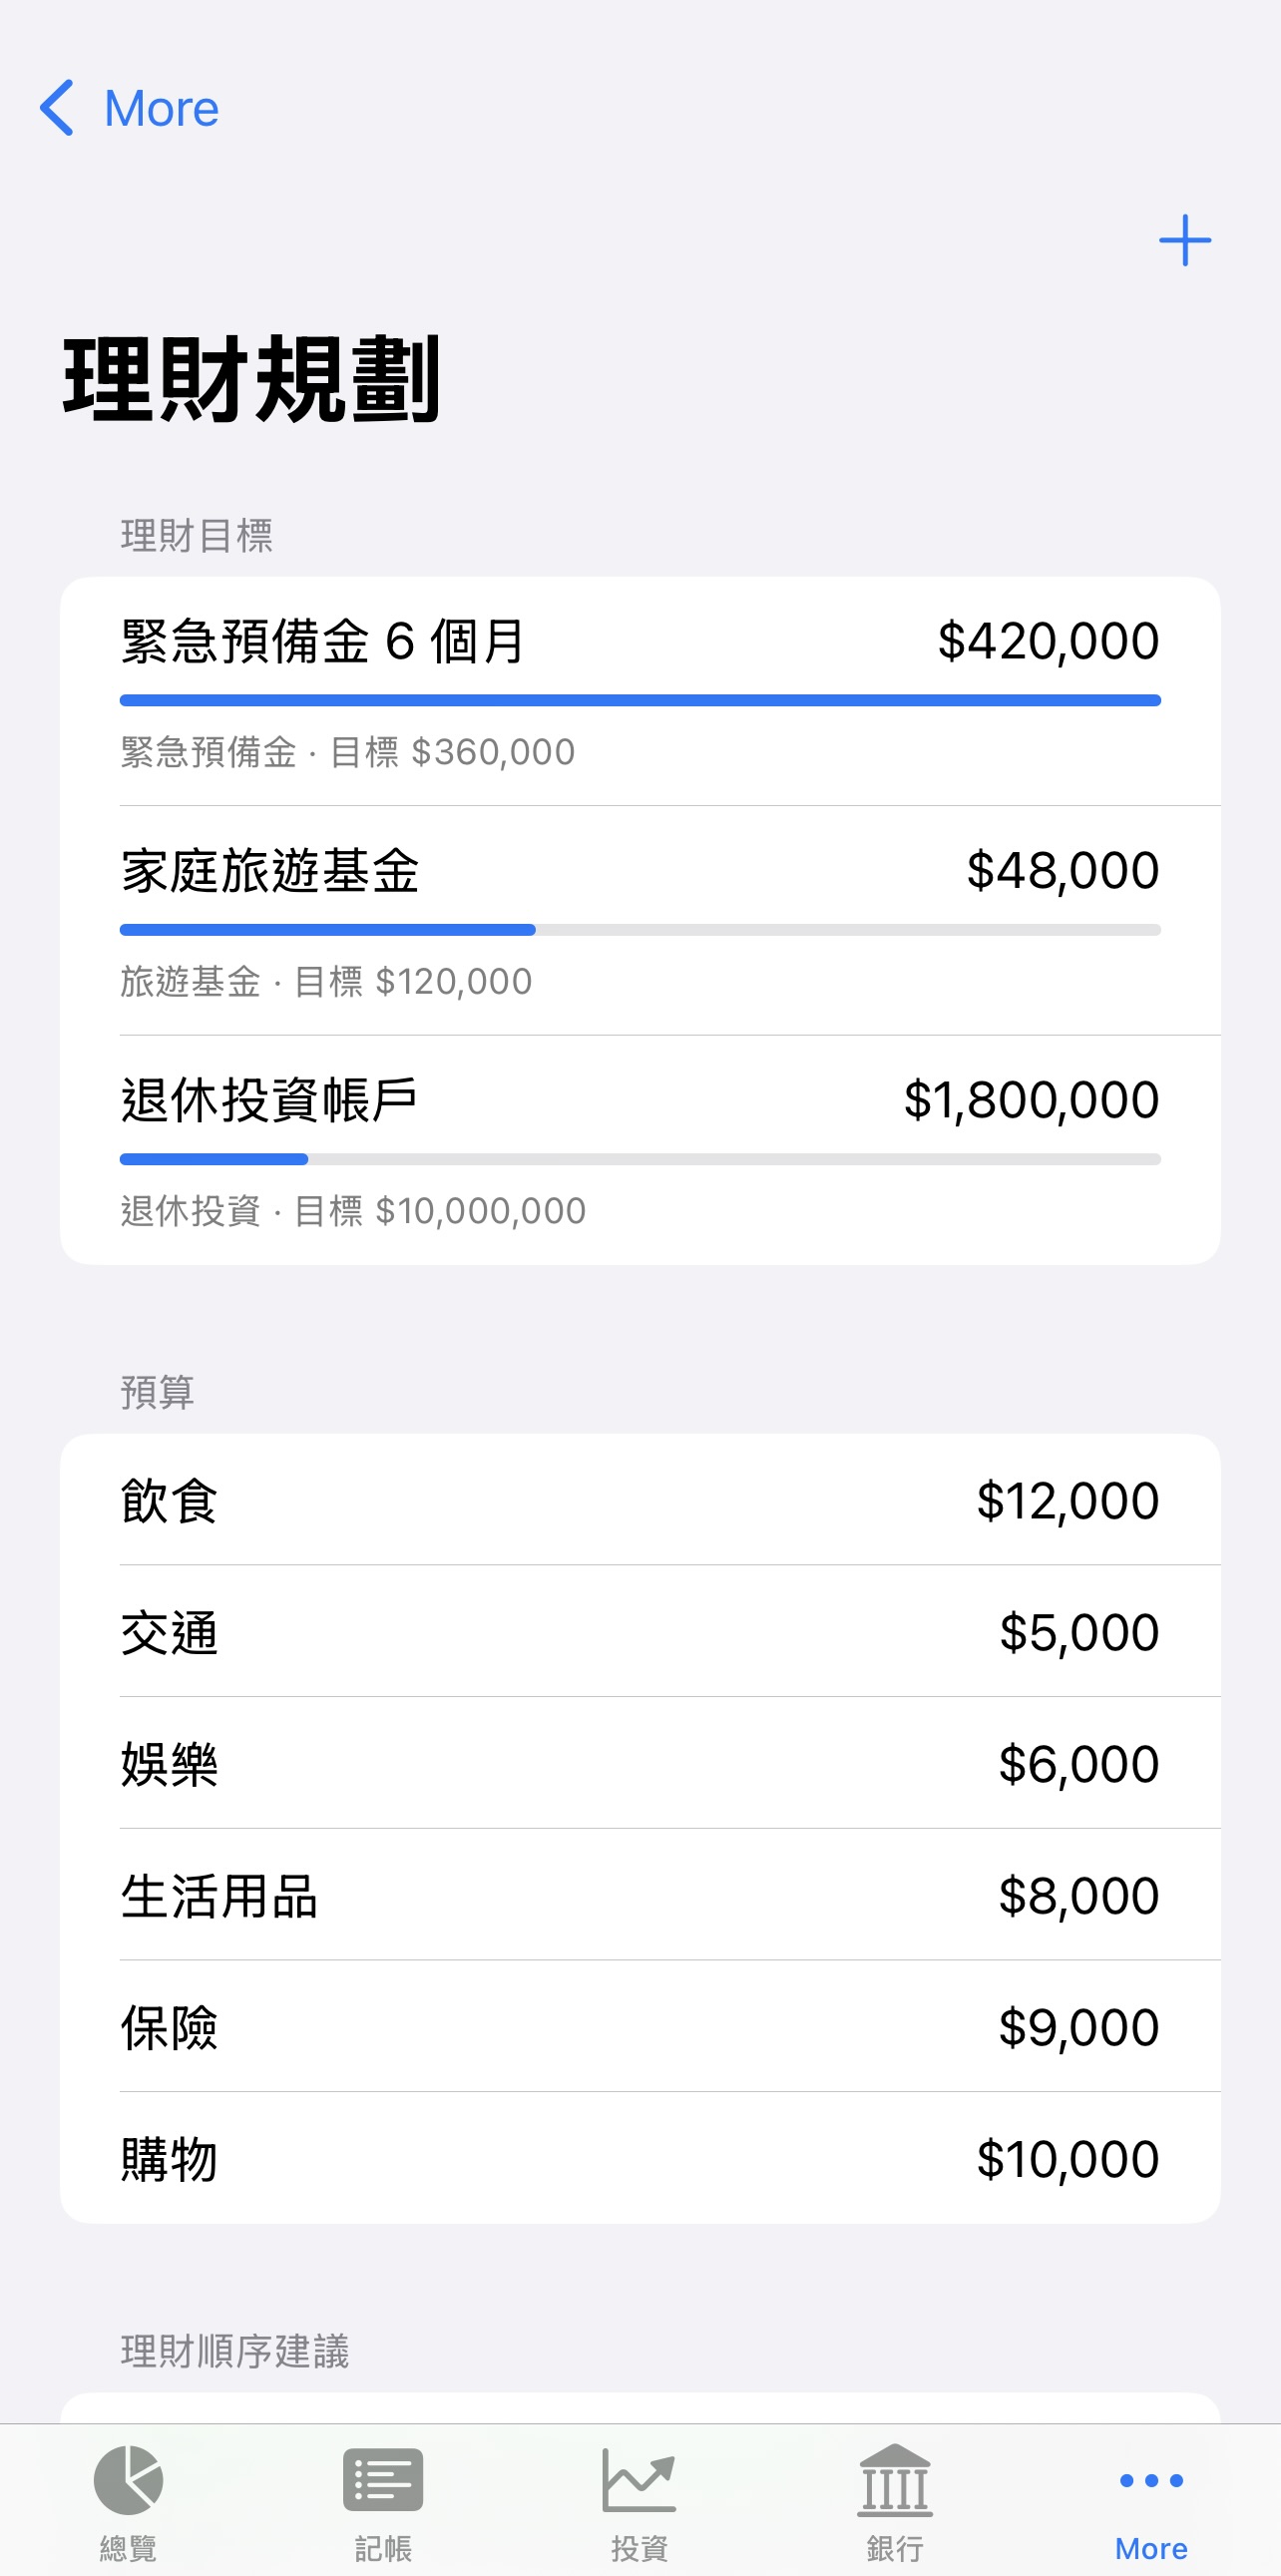
                                  Goals & Budgets — savings goals with progress bars (emergency fund, travel fund, retirement investing) and a category-based monthly budget list
                                  Data Security & Backup
                                  Security status and data management
                                  Security Status & Data Management — a plain-language explainer of every protection in place, plus data actions like loading sample data, snapshotting, and importing/exporting
                                  In-App User Guide
                                  First-time setup
                                  First-Time Setup — three steps to get started (add bank accounts, import or enter assets, save today's snapshot) plus daily-use tips
                                  Stock, insurance, real estate and loan tips
                                  Stock, Insurance, Real Estate & Loan Tips — how to add holdings, refresh prices, read the P&L trend, and record policies, property and loans correctly
                                  Charts, backups and security tips
                                  Charts, Backups & Security Tips — why snapshots matter for trend charts, how to read chart values, and guidance on encrypted backups vs. plain-text JSON